Analyzing price is the simplest yet most effective way of gaining an edge in forex trading. Every tool or indicator used in technical analysis derives its readings from price, one reason why technical traders pay close watch to price movement. Therefore, price action is at the heart of any effective analysis in the currency market.
What is Price Action?
Price action is a widely used trading technique whereby traders try to read the market and make trading decisions based on historical price data. The trading strategy focuses on the characteristics of past price movement rather than fundamentals.
Traders leverage price action analysis to look at the historical price to gain clues on where the market is likely to move. The study of price bars allows traders to gain insights on highs and lows in the market. Similarly, price action will enable traders to identify potential resistance and support levels.
Price action analysis ignores fundamental analysis opting to focus more on past and recent price movements; likewise, the trading strategy depends on technical analysis tools in predicting future price movement.
Price Action Indicator
The most widely used indicator in price action analysis is candlestick patterns, focusing on individual candlesticks. The study of candlesticks allows traders to gain useful insights into the market’s opening and closing price. Likewise, traders focus on the high and low price levels as defined by different price levels.
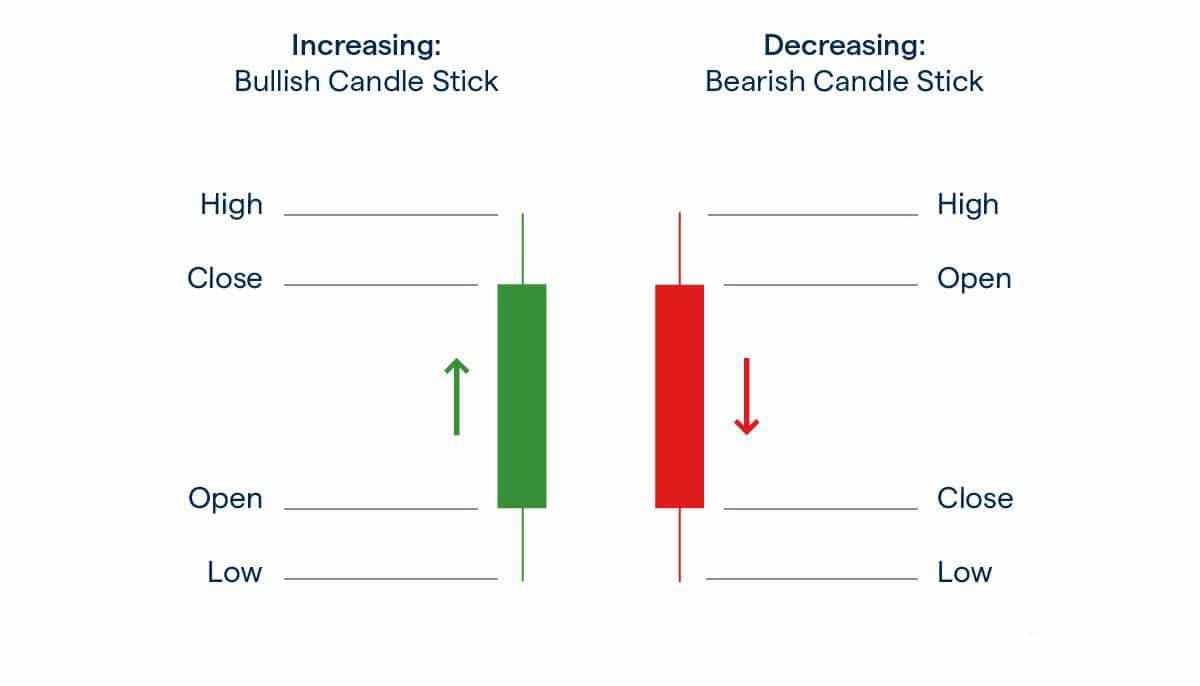
The high and low in the two candlesticks tell of the highest and lowest points that price moved. The red candlestick means that sellers won the battle, conversely pushing price lower. On the other hand, the green candlestick tells of how buyers won the battle, resulting in price closing higher than the opening price.
Depending on how candlesticks align themselves in charts, they give rise to essential chart patterns that traders use to enter long and short positions. Likewise, candlesticks are at the heart of price action trading strategies.
Price Action Trading Strategies
The Hammer Pattern
The hammer is a crucial candlestick pattern that signals price is about to move higher after moving lower. The price action trading strategy finds excellent use in trending markets.
The hammer candlestick indicates that sellers pushed prices lower to a new low. However, buyers came into the market, conversely pushing the price higher. With the buyers winning the tussle, the candlestick closes at the upper half leaving behind a long stick.

While the closing price can be below the opening price, the hammer signifies strong upward momentum whenever the closing price is above the opening price.
In the case of a hammer candlestick pattern, the ideal entry point would be when the next candlestick manages to break the hammer candlestick’s high. The higher the second candlestick closes, the stronger the emerging uptrends.
Inverted Hammer Pattern
The inverted hammer pattern signals to brew buying pressure on price, moving lower for an extended period. The candlestick is the opposite of the hammer.
The price action pattern indicates that buyers pushed the price higher. However, sellers once again came back into the fold and tried to push the price lower. Given the strong buying pressure, the candlestick fails to close lower, signaling surging buying pressure.
Likewise, the price pattern suggests buyers will soon have control.
Shooting Star Price Action pattern
The shooting star candlestick pattern is a bearish pattern that signifies price is about to edge lower. The candlestick itself is the opposite of the hammer and mostly occurs at the end of an uptrend.
The shooting star shows that buyers pushed the price higher; however, sellers came into the market and succeeded in overpowering buyers, conversely pushing the price lower. In most cases, the opening and closing prices of a shooting candlestick occur in the lower half of the candlestick. The candlestick signifies strong bearish pressure whenever the close is below the opening price.
The best entry point whenever the shooting star candlestick happens is when the second candlestick manages to break below the shooting candlestick. The stop loss would, in this case, be placed a few pips above the shooting candlestick.
Bearish Engulfing Price Action Pattern
A bearish engulfing is a price action chart pattern that signals price is likely to drop on surging bearish pressure. The candlestick pattern consists of a small bullish candlestick that is followed by a large bearish candlestick. The bearish candlestick is big, such that engulfs the previous bull candlestick.
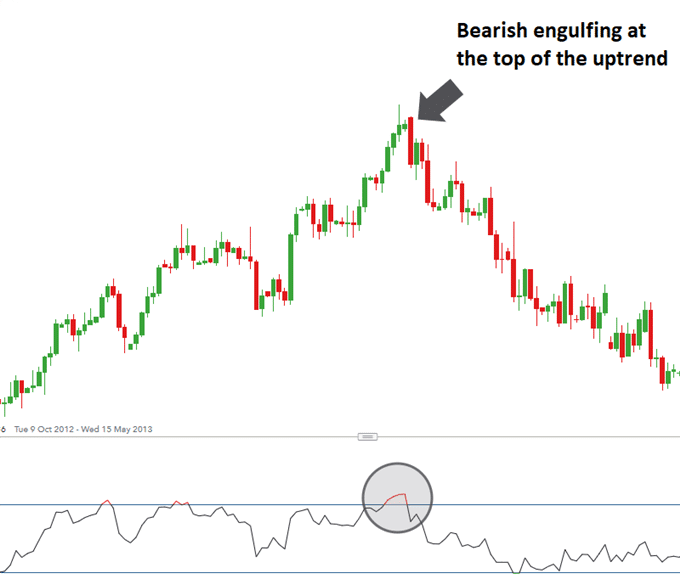
Whenever the bearish engulfing candlestick occurs, it shows that sellers have overpowered buyers and pushed prices lower more aggressively. The price action pattern often occurs at the end of an uptrend.
The bearish engulfing price pattern is reliable whenever the engulfing’s open price is well above the close of the bull of the previous candlestick and ends closing well below the open of the bull candle. A much larger down or big bearish candlestick signifies more strength in the downward pressure.
Bullish Engulfing Pattern
The bullish engulfing price pattern occurs at the tail end of a downtrend. It mostly occurs whenever price moves lower for an extended period to an extent sellers start to exit the market. It is a two candlestick reversal pattern that occurs whenever a bullish candlestick is big to engulf the previous bearish candlestick.
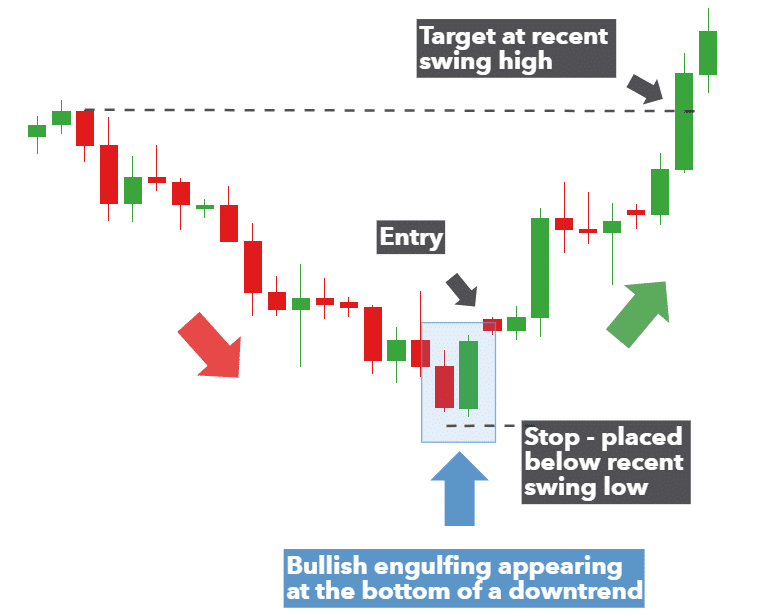
The candlestick occurs whenever the candlestick opens lower but ends up closing much higher than the previous candlestick such that it engulfs it. Price action traders use this opportunity to enter a long position whenever the second candlestick closes higher than the engulfing candlestick.
Bottom Line
The key to success in any price action strategy is to focus on price movements while placing less attention to fundamental data that often trigger noise. Focusing on price patterns, trends, and another technical analysis allows traders to create effective trading strategies, ideal for squeezing profits in the currency market. When it comes to price action analysis, it is important to master various candlestick patterns as they provide valuable insight into where the price is likely to move. In addition to studying candlestick patterns, technical indicators can also enhance a price action strategy.