
Cryptocurrency trading can be a highly profitable activity to do. It is defined as the process of buying and selling digital coins with the goal of generating strong returns. Traders, unlike investors, are only interested in short-term price movement of cryptocurrencies. In this article, we will look at some of the most important 1-minute crypto trading strategies.
What is a 1-minute trading strategy?
A 1-minute trading strategy is an approach where a trader uses one-minute charts to analyze the market. These are extremely short-term charts that don’t show the broader trend of a cryptocurrency or any other financial asset.
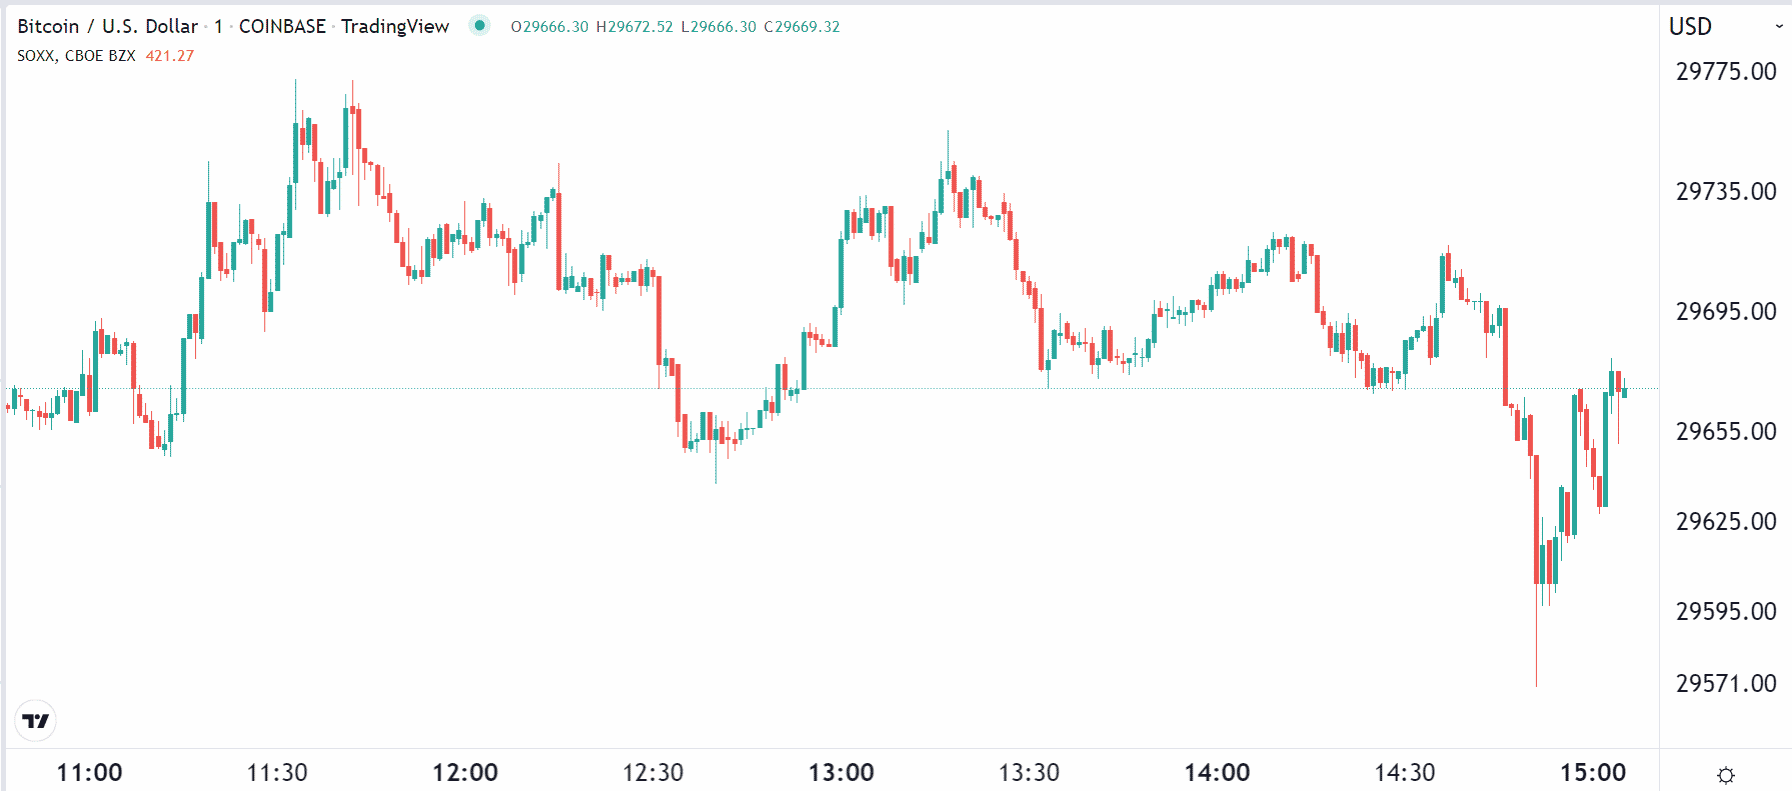
1-minute charts are widely used by day traders or scalpers and are not ideal for swing traders and long-term investors who buy and hold cryptocurrencies for a few days and weeks. The chart below shows how a 1-minute Bitcoin chart looks like. In this chart, each bar represents 1 minute.
So, here are some of the top 1-minute chart trading strategies in cryptocurrencies.
Multi-timeframe analysis
The first common day trading strategy among traders who use this approach is known as multi-time frame analysis.
This is an approach where a trader starts with a long-term chart and then moves to the extreme short-term one. The idea is to check the overall trend of a chart and identify potential support and resistance level.
In a 1-minute chart, you can decide to start by looking at the 30-minute chart and then move to the 15, 5, 3, and then 1-minute chart. As you do all this, you should be using the analysis tools provided by your charting platform to identify key levels.
In the 15-minute chart below, we have identified the key support and resistance levels. The chart has also included the Fibonacci retracement levels.

Now, when you shift to the 1-minute chart, you will have all these levels as your reference points. For example, you can add your stop-loss and take-profits at these levels.
There are several benefits of using this strategy in cryptocurrency trading. First, it is a useful approach that helps you identify support and resistance levels. Second, it lets you have a bigger picture about the market because a coin might be trending in a 1-minute chart but be in a consolidation mode in an hourly or daily chart.
VWAP trading approach
Volume Weighted Average Price (VWAP) is one of the most popular indicators used by day traders. In fact, unlike other popular indicators like moving average and the average directional index, VWAP is only used for day trading.
As the name suggests, VWAP is an indicator that considers the average price of an asset in a certain period while factoring in its volume. When applied in a chart, VWAP is a single line that moves up and down depending on the assets movement.
There are several approaches to using the VWAP indicator in a 1-minute chart. First, you can use the VWAP indicator to identify a crossover. The idea is simple. If the coin moves below the VWAP, it is a sign that the coin will continue falling.
Similarly, if it moves above the VWAP, it is a sign that the bullish trend will continue. In the chart below, we see that Cardano continued its bearish trend when it moved below the VWAP indicator.
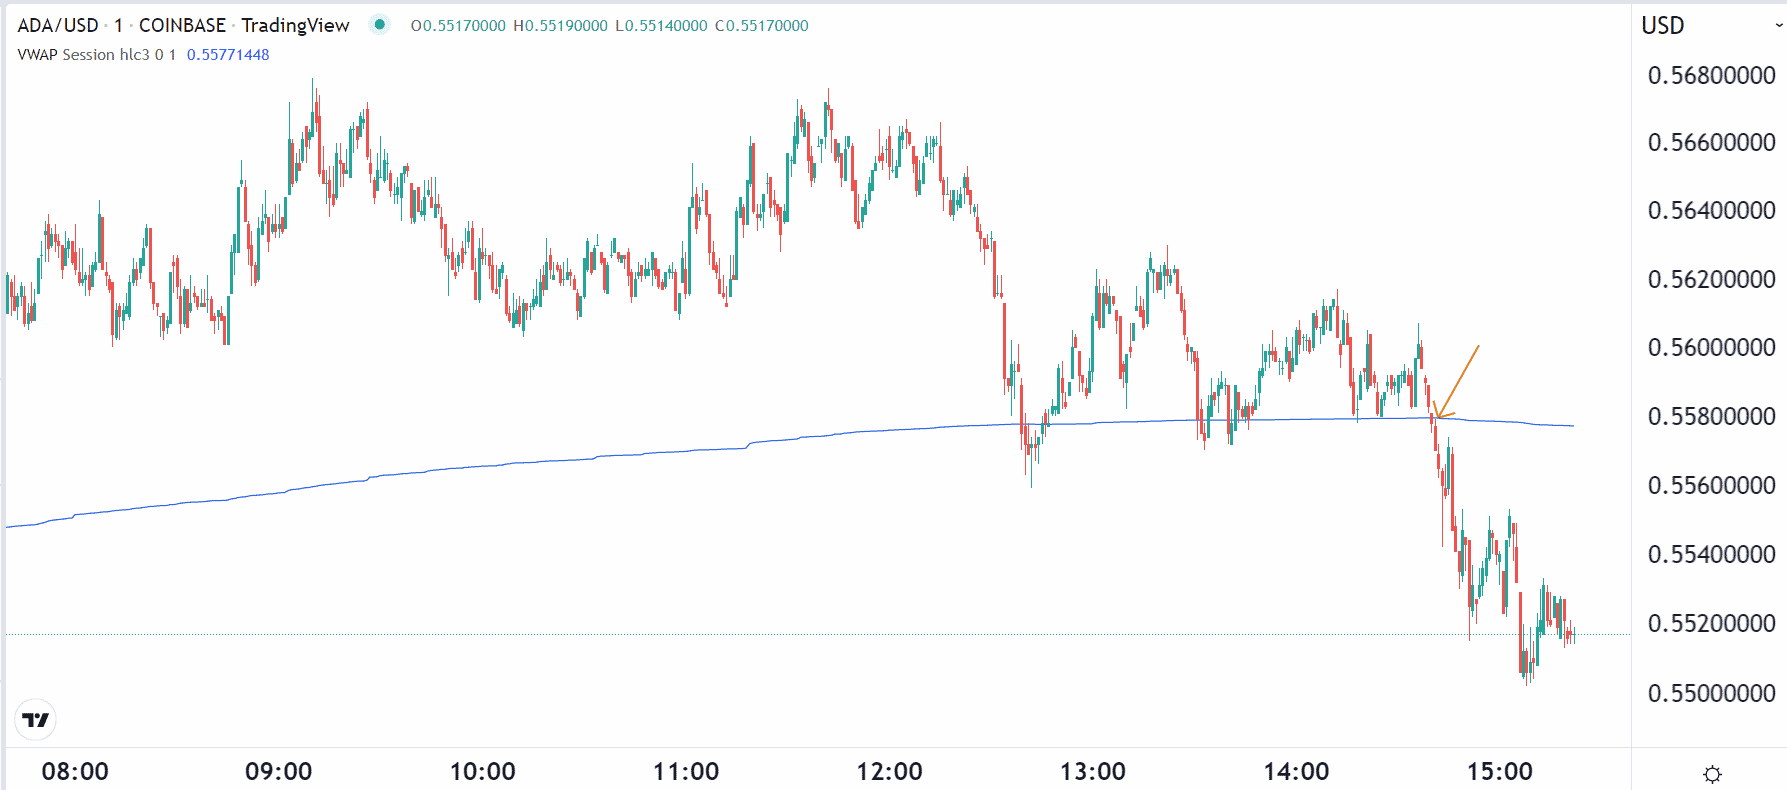
Second, you can use the indicator to identify a stop-loss and a take-profit after you place a trade. A stop-loss is a tool that automatically stops a trade when it reaches a certain loss level, while a take-profit is one that stops it when it moves to a pre-determined level of profitability. Finally, you can buy an asset if it is moving upwards and is above the VWAP indicator.
Moving average indicator
The other important day trading strategy when using a 1-minute chart is the moving average (MA) indicator. MAs use historical data to identify the average price of an asset in a certain period. There are several types of moving averages, including simple, exponential, least squares, and weighted. Their concept is relatively the same, although they are calculated differently.
There are several strategies for using the moving average indicator in a 1-minute chart. First, you can use it in trend-following. This is where you buy a cryptocurrency whose price is rising or a short one that is falling. You will then ride the trend until it crosses your preferred moving average. A good example of this is shown in the chart below.
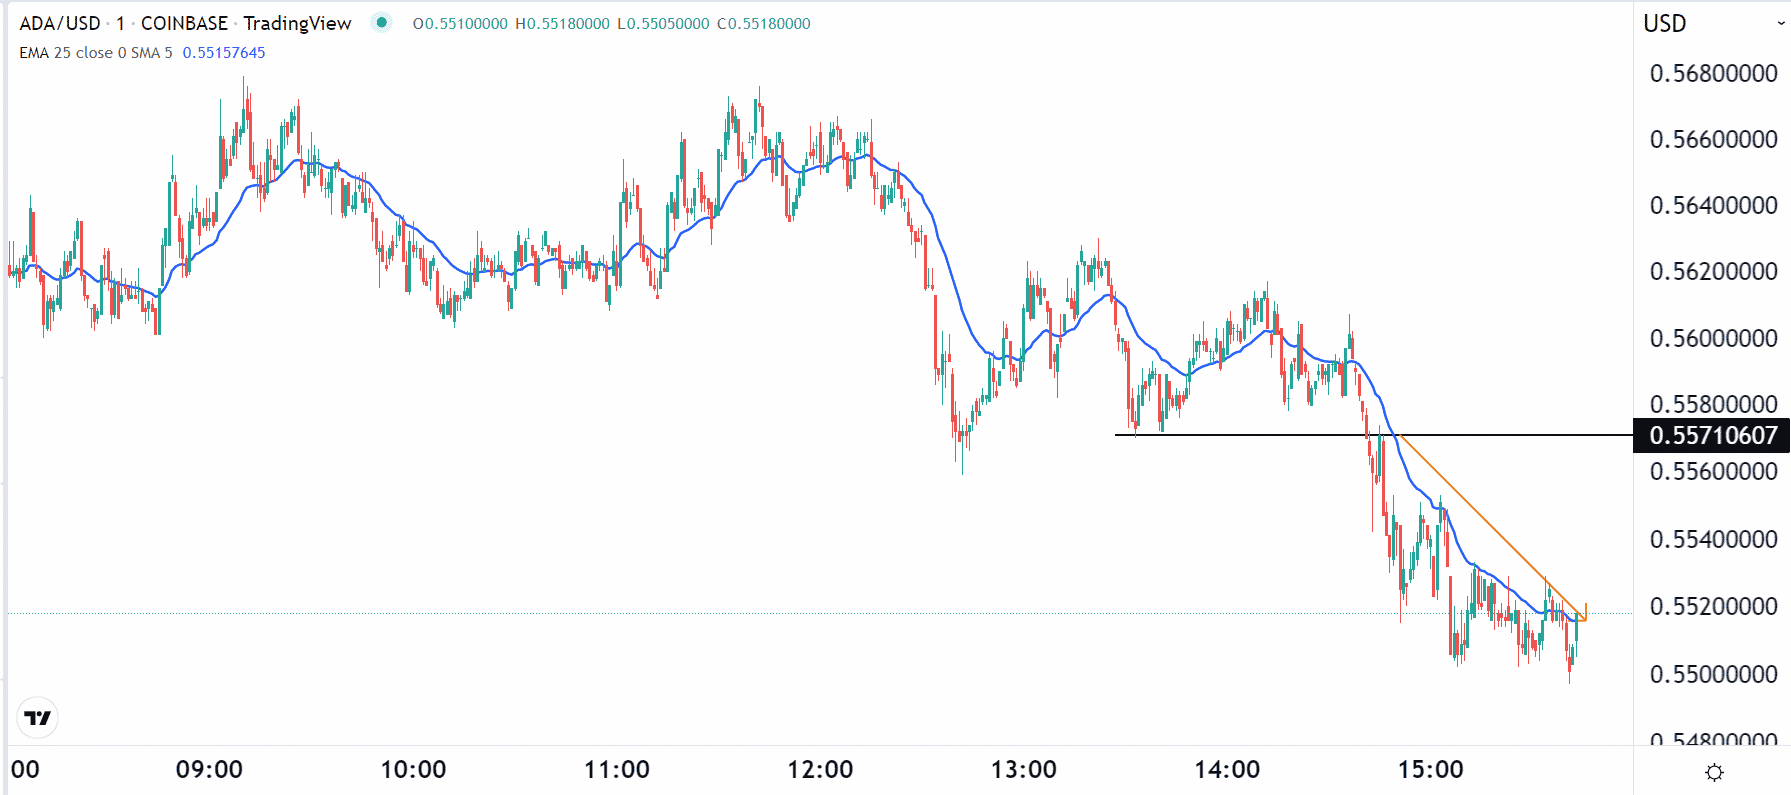
Second, you can also use moving averages to find reversals in a chart. A good approach is where you use a combination of a fast and short moving average and identify their crossover. Finally, you can use the indicator in combination with others like the RSI and MACD.
Price action analysis
Another popular 1-minute trading strategy is known as price action. It refers to identifying chart and candlestick patterns to predict the direction of the asset. There are two main types of chart patterns: reversals and continuations.
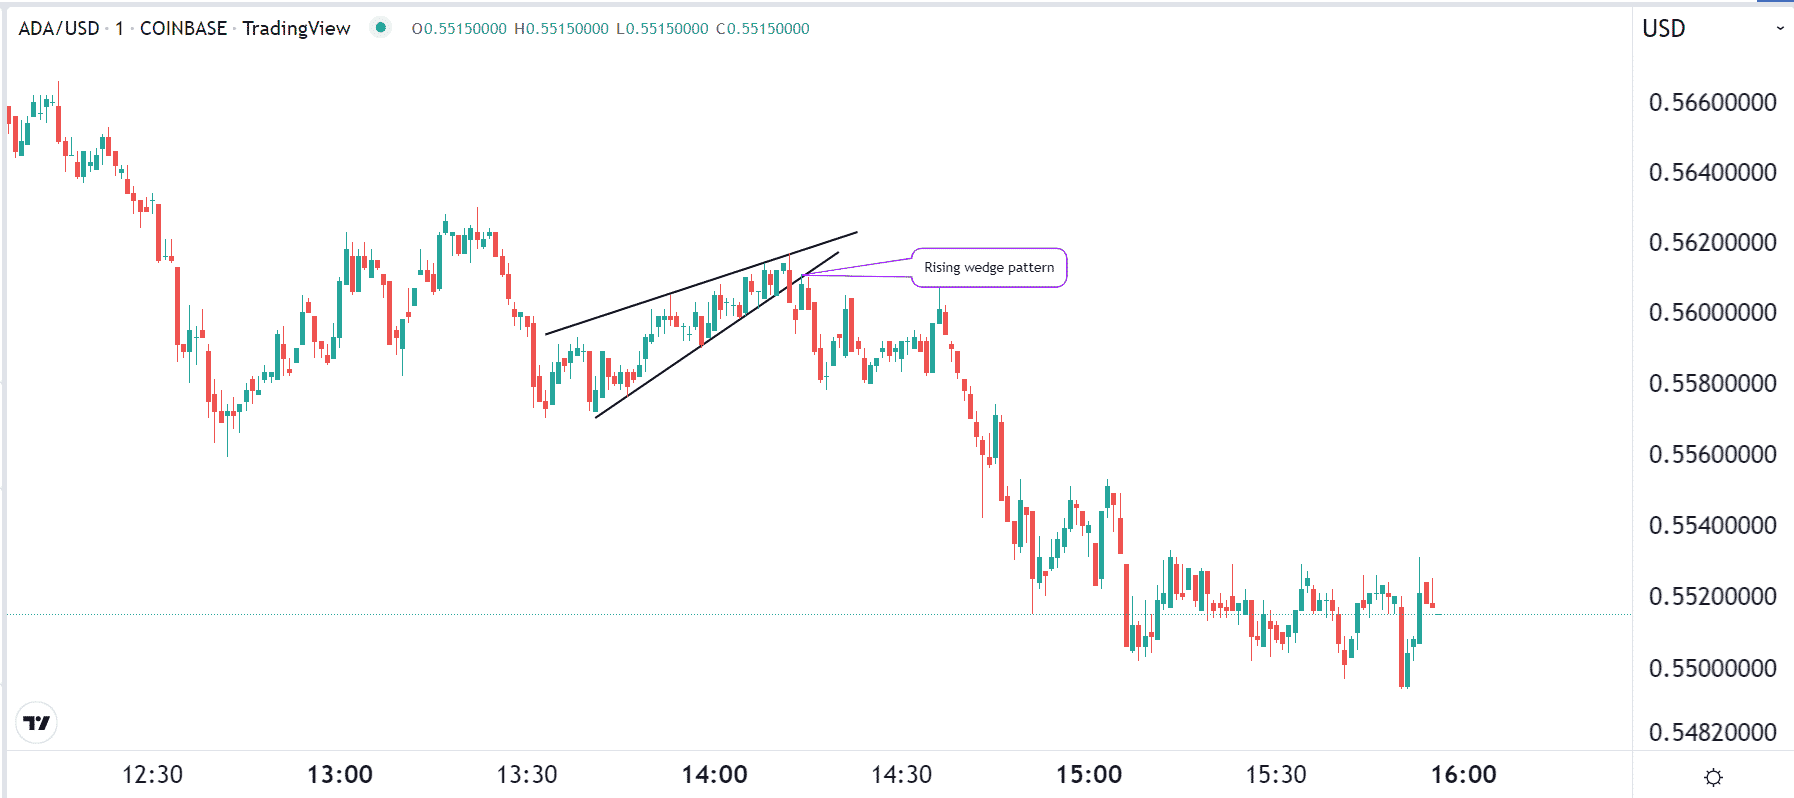
Reversals signal that an asset’s price is about to start a new trend, while continuation is a sign that it will continue with the original trend. Examples of reversal patterns are wedges, head and shoulders, and double top. On the other hand, the continuation ones are ascending and descending triangles and bullish and bearish pennants and flags. The chart below shows how a rising wedge pattern works.
You can also use candlestick patterns to make these predictions. Examples of these patterns are the hammer, doji, harami, and evening star.
Summary
A 1-minute chart trading approach is mostly ideal for day traders instead of swing and position traders. It is a popular strategy that can work when used well. In this article, we have looked at some of the most popular strategies to use when using 1-minute charts.