For a novice trader, knowing where to start may seem daunting at first. Trend indicators can improve your market analysis and trading skills. They accelerate your trading career by optimizing your profits. Learn how you can apply trend indicators for a smoother and more profitable trading experience.
What are Trend Indicators?
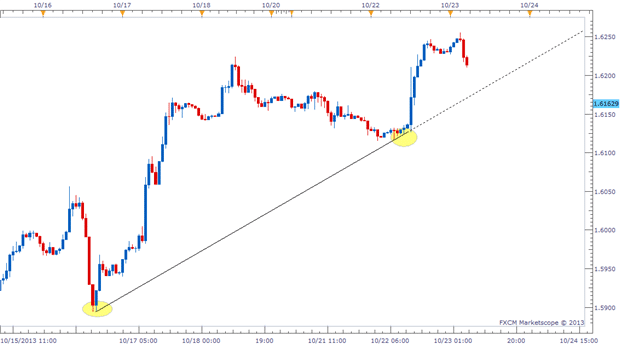
Before understanding trend indicators, it is important to understand what trends are. A trend is simply the direction in which a particular asset or the market moves. By plotting the value of the asset over a series of days, you get a trend line that indicates the price movement of that asset.
Trend Indicators are among the finest tools in the reserve of professional traders. They are tools that measure the attributes of a trade. They test the direction, strength, volatility etc. of an asset or market for any given time period. Learning to apply trend indicators to make actual trades is not achievable overnight. You may need to give a little time to understand the fundamentals. But once you understand the basics, you will be able to easily pick up how to read trends and use them to make smarter trading decisions.
In a volatile market, optimal use of the indicators helps you to make the market work for you by seizing opportunities as they come. Keep in mind that you need to use multiple trend indicators to get a broader view of the market for successful trading.
Types of Trend Indicators
Here are some popular trend indicators that successful traders use to interpret the market scenario:
- Moving Averages (MA):
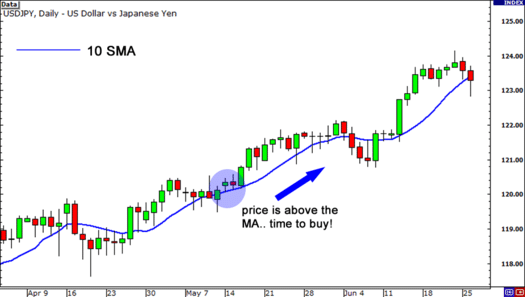
In trend analysis, a moving average is a method that uses the asset’s values to create a continuous trend. A great tool to start-off trend analysis, moving average smooths out price data over a period of time, making it very easy for traders to identify trends. You can develop a comprehensive analysis by using simple, exponential, or linear moving averages for different data sets. MA can be calculated for any sequential data set, including opening and closing prices, highest and lowest prices, trading volume or any other indicators and can be used to identify both short-term and long-term trends.
There are a few points to consider while using a moving average:
- Direction of the moving average represents the movement of the asset. A rising average line denotes an uptrend while a declining average line denotes a downtrend.
- MA helps reduce extreme values and noise from a regular trend line.
- Calculation : SMA= Closing Price of Asset / Number of time periods
- Average Directional Index
This is an index that indicates how strong a given trend is. It is represented using two sub-indicators: The Positive Directional Indicator and the Negative Directional Indicator. The trend of ADX registers upward or downward movements.
- When the positive indicator is above the negative indicator, the price shifts higher.
- When the negative indicator is above the positive indicator, the price shifts lower.
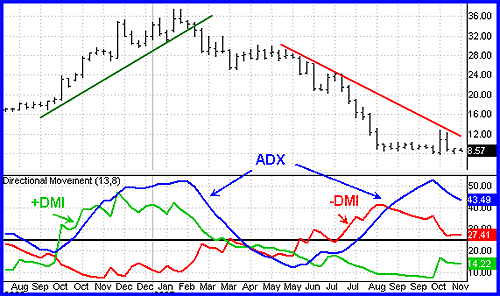
A strong trend has a value of more than 25, whereas a weak trend has a value of less than 20 on the ADX. A weak trend is a sign for traders to hold back and wait for the weak trend to pass. At the arrival of a strong trend, traders can enter the markets openly. This indicator is crucial to safe trading. A strong trend is safer for investors as it minimises the uncertainties – this is the point where profitable traders maximise their earnings.
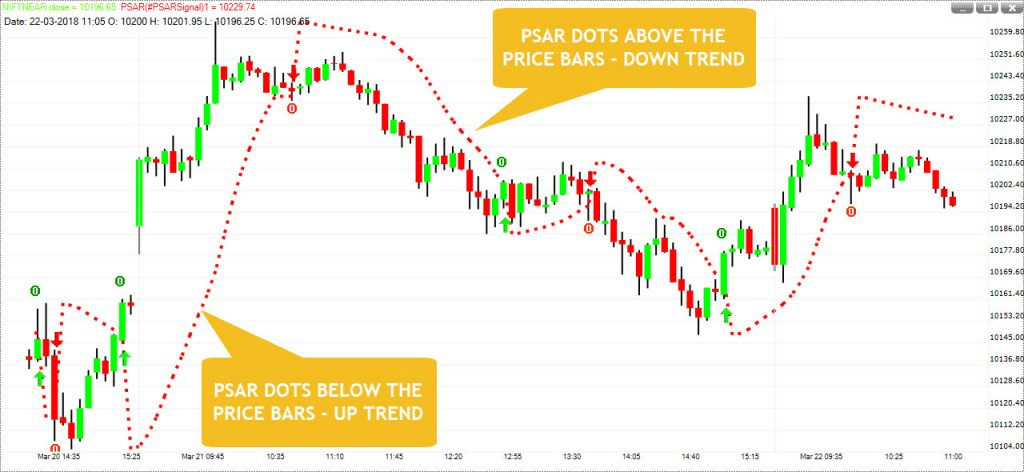
- Parabolic SAR:
A parabolic SAR (Stop and Reverse) is an indicator that focuses on the direction of the trend. It indicates the direction in which the trend is moving and also identifies trend reversals. A trend reversal is simply a change in the direction of a trend. Many traders use PSAR to plot the Stop-Loss on the trend. A Parabolic SAR is represented using dots placed above or below the price line on a regular price chart. The position of the dots determines the direction of the trend – dots above the price denote a downtrend while dots below the price indicate an uptrend.
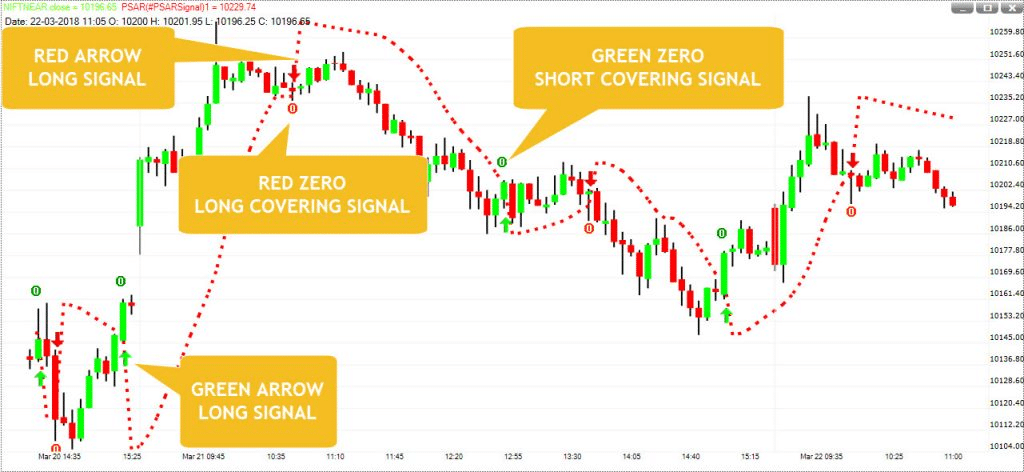
PSAR informs traders when to take short or long positions in the game. For example,
- When there is a green arrow under the price line, it suggests a long position.
- A red arrow below the price line denotes the closing of a long position.
- On top of the price line, a red arrow represents a short position taken.
- A green arrow on top represents the closing of a short position.
It is advised to use a PSAR in the short-term. Since there are too many variables affecting the long-term performance of an asset, relying solely on PSAR may not give you reliable results.
- Moving Average Convergence Divergence
MACD is a technical indicator that shows the relationship between two or more moving averages for any asset. It is used to recognise the onset of a new bullish or bearish trend. When two moving averages meet, it is known as a convergence. In case of divergences, the two moving averages move away from each other.
A regular MACD indicator consists of the following parts:
- The MACD line shows how far the two averages are from each other.
- The Signal Line represents the momentum of change in the price of the asset.
- The Histogram represents the difference between the above two.
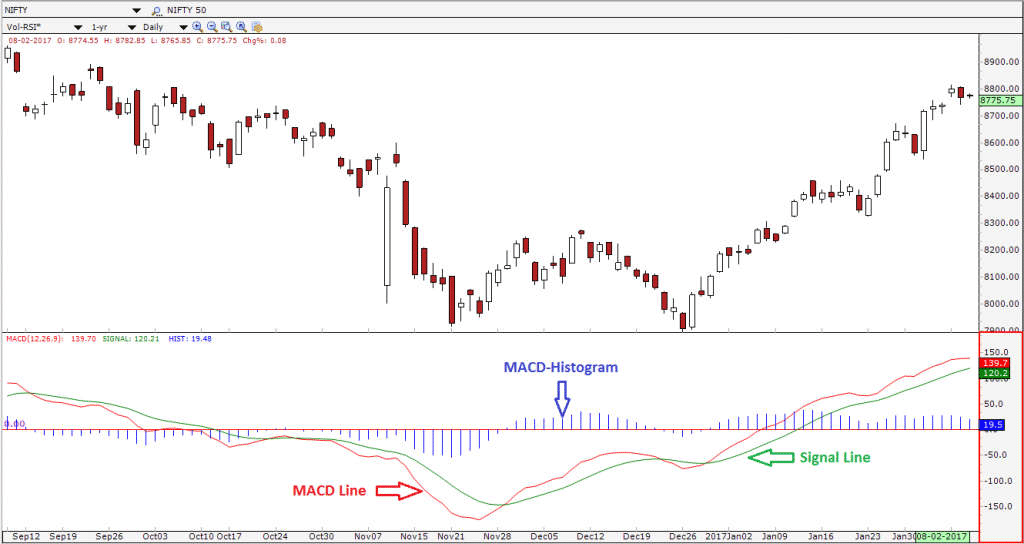
Consider, MACD Line= 12-Period Moving Average – 26-Period Moving Average
To form an MACD line, you need to subtract the 26-period moving average from the 12-period moving average. The signal line is formed using the 9-period moving average. When the MACD line crosses the signal line from below, it’s a signal to buy. When it cuts the signal line from above, it’s a signal to sell for traders.
Bottom Line
Trend indicators are used to conduct technical market analysis to spot trends and make effective trades.They have gained popularity for enabling easy and effective market analysis. A variety of indicators are available for traders such as the moving average, ADX, Parabolic SAR, and MACD for a comprehensive technical analysis. Make sure you don’t depend on a single indicator to make crucial decisions – a healthy set of risk management and portfolio diversification along with sound technical analysis is what will ensure long-term profitable and sustainable investments.