
When a forex pair is oversold, it generally implies that increased selling has pushed down the price to an extreme level. Traders who scan these pairs will anticipate a bouncing reaction since, at times, the pairs are almost undervalued or below the real value. At this point, the pair is trading at or near its bottom, and the fishers here will want to buy and take advantage of the pricing. However, most traders do not wait for the real bottom trend to form. Upon buying the pair, it may continue to drop further, 20% to 30%, until the trader quickly changes position.
Trading implication
The implication of trading an oversold stock in most instances is that heightened selling may make the prices bounce back and start rising. This situation contrasts an overbought pair that implies excessive buying has pushed prices higher, necessitating a pullback. Traders should be wary and note that the decrease in price (in the case of overselling) and an increase in price (in the case of overbuying) does not mean the price cannot keep the trend.
Prices may continue moving higher after the trader establishes overbuying or lower in the case of an oversold pair. For instance, in a bearish market, the trading pair may continue to decline before hitting a temporary bounce. It is vital to distinguish this bounce from a reversal since it takes place temporarily.

Figure 1: Overselling point in EUR/NZD trading pair
In figure 1, after the stock begins to decline, it meets with four short retracements before the actual decline continues. The pair’s price action continues until it settles below 1.6400. After this point, prices begin the reversal from March 2021, and the uptrend takes shape. To avoid trading at an oversold option that is yet to form, it is vital to consider indicator guidelines.
Indicators
- Relative Strength Index (RSI)
This momentum indicator measures the strength of fresh price changes and informs the trader if the forex pair or stock has been overbought or oversold. The RSI ranges between 0-100 where 30 is the threshold of oversold while 70 shows an overbought asset. If the trader is checking for an oversold option, he will ensure the RSI is oscillating between 0-30, with most pairs trading at a level of 20 before a reversal takes place.
In most cases, the buy signal is given after the RSI decreases into the oversold region (30 and below) and then hits bullish reversal. The pair will confirm a bullish reversal when the pair opens higher than it closed.
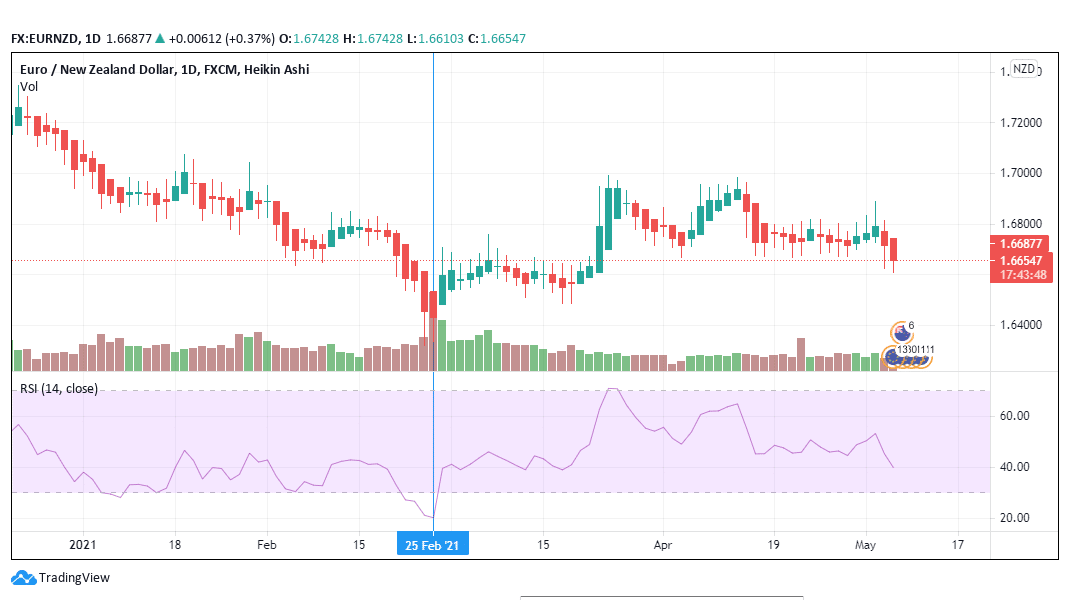
Figure 2: RSI tracker on the EUR/NZD trading pair
As of February 25, 2021, the RSI of the EUR/NZD trading pair was 20.25, before it hit the reversal trendline. The decline that had begun on December 23, 2020, had an RSI of 52.21. The opening price at the time was 1.7190.
The daily price decline continued until January 8, 2021, when it stood at 1.6852 (-1.97%) at an RSI of 28.18. At this point, the trader may prepare to buy the pair since it is already at an oversold point. The two-day upward retracement on January 11 and 12, 2021 was inadequate to convince the trader that a potential upside was coming since the RSI only rose to 33.32 before it failed to confirm the bullish reversal.
One critical factor to note is very slight divergence between the price trend and the RSI. In figure 2, the price pattern coincides with the RSI until the fourth retracement takes place from February 10-15, 2021. During this period, the underlying increase in price does not correspond to the RSI. The RSI moves horizontally and shows a declining trend until it begins the downtrend from February 16, 2021. Since this divergence only takes place in this region, the trader will now prepare for a short-term bullish reversal after the oversold is confirmed.
- Volume
There is an indirect relationship between the volume movement and price action. When volume increases, the price of the trading pair or stock will decrease. This increase is mainly caused by an increased selling action among traders. When the volume decreases, traders prepare themselves to sell the pair. The belief here is that there is a potential rise in price about to take place.
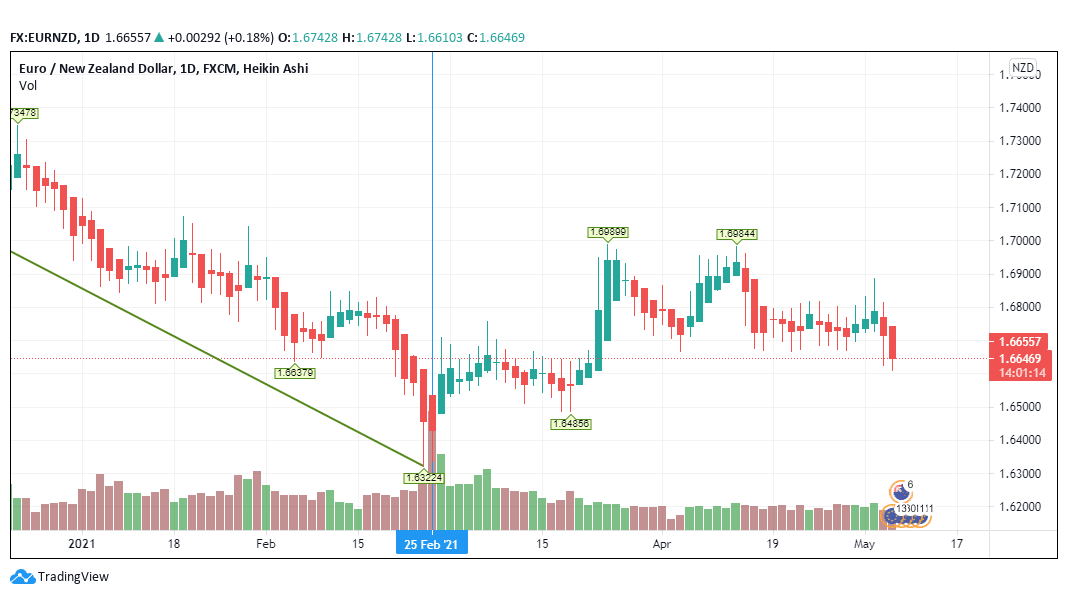
Figure 3: Volume movement in the EUR/NZD
The continual increase in volume indicates that the pair is moving towards the oversold zone. As the volume increased, the price declined until it attained the lowest trend line. In figure 3, the lowest region acts as the support area for the increase in prices. As a swing trader, you will wait until the volume decrease confirms the oversold position.
The zigzag indicator in figure 3 also shows that the trendline is about to change. It follows the decline in volume as the price closes to the oversold region.
- Exponential moving average (EMA)
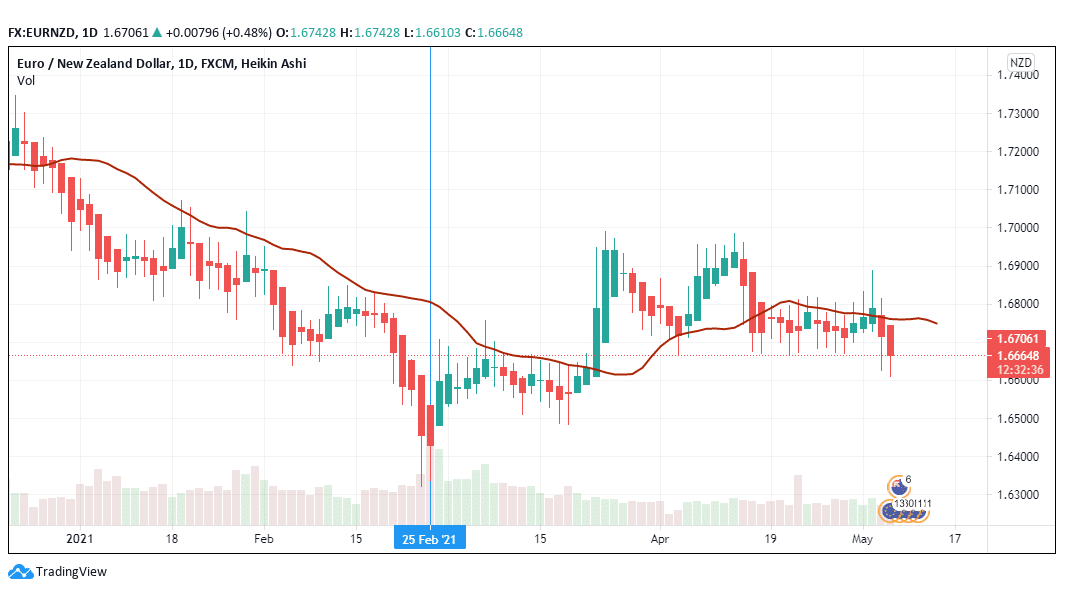
Figure 4: EMA 20-day close in the EUR/NZD trading pair
The 20-day exponential moving average (EMA) as used in this trading chart shows the relationship between the price and volume trends in the short and long term. Other than the EMA, the trader can also use the simple moving average (SMA) to indicate price turning points and trend continuations.
In figure 4, the EMA position shows a bump as it nears February 25, 2021. This bump indicates a trend change from a downtrend to an uptrend. The trading pair moves towards the oversold position thereby giving a buy signal.
Conclusion
A trading pair is considered a bargain when it reaches the oversold condition. However, it is vital to establish the correct oversold position to avoid premature buying. The trader should use various indicators to establish whether the forex pair has attained the oversold status. When the RSI hits 30 and below, a trader should prepare to sell. Wait until the RSI hits the lowest point before you sell. Other aspects such as volume increases and moving averages are essential in estimating the price change.