
Bitcoin trading is the process of opening and closing trades with the goal of making a profit. It differs from investing, which involves buying and holding Bitcoin for a few days or months. In this article, we will look at the idea of Bitcoin trading and why timeframe is important. Precisely, we will assess the different types of timeframes and some strategies that you can use.
Timeframes in Bitcoin trading
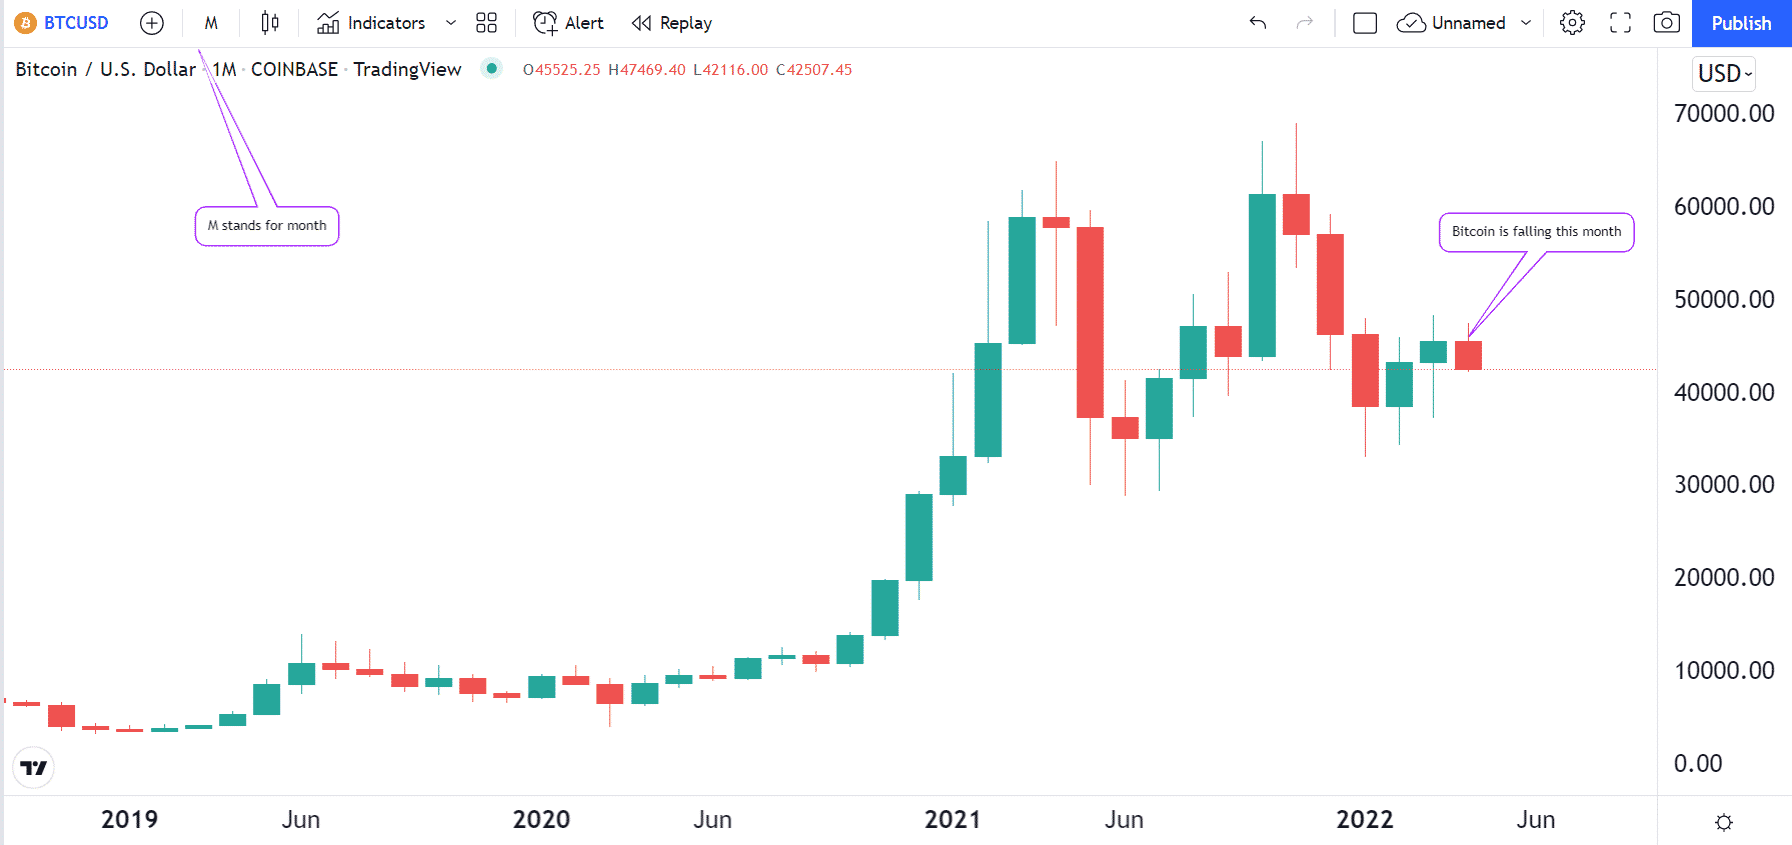
The timeframe is an important concept in Bitcoin trading. By timeframe, we refer to the specific time that you are analyzing. To explain this idea well, let us use the chart below as an example. Since this is a monthly chart, every candlestick bar represents a single month.
We are writing this article in April 2022. As such, you can see that Bitcoin has declined during this month. Since the previous two bars are green, Bitcoin rose in February and March. Similarly, whenever you see an hourly chart, each bar represents 1 hour and so on.
Timeframes are important because traders use different approaches. For example, it does not make sense to use a monthly chart for a trader who focuses on intraday trading. The chart just takes more time to form, and signals will often be inaccurate. Therefore, a monthly chart is only recommended for a person who is focusing on the long-term.
Types of Bitcoin traders
To understand the best timeframes to use in Bitcoin trading, we need to look at the broader types of Bitcoin traders.
Scalpers
Scalpers are Bitcoin traders who focus mostly on extremely short-term charts. Their goal is simple in that they just want to open trade now and close it within a few minutes with a profit. As a result, they are not interested in longer-term charts such as daily, weekly, and monthly.
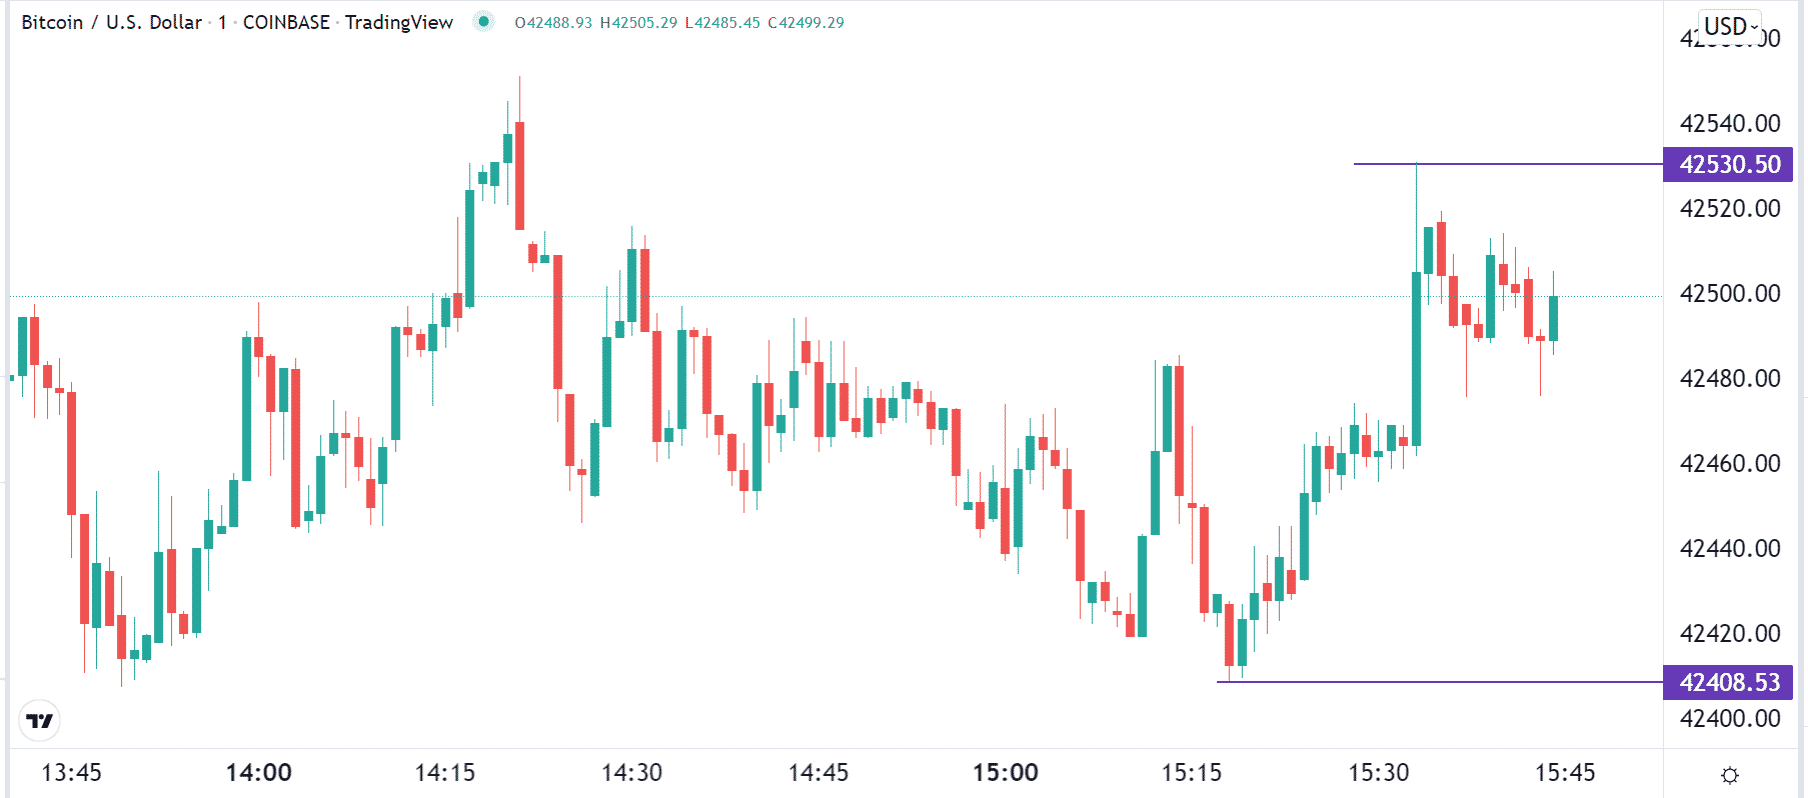
Scalpers make their money by using extremely short-term charts. In most cases, they are usually comfortable with a 1-minute chart. A good example of this is shown in the chart below. In this case, a scalper could have bought Bitcoin at $42,408 and then exited when it rose to $42,530 with a profit.
Other scalpers focus on 3 and 5-minute charts. Because they enter and exit positions in a short period, they analyze longer-term charts like hourly and daily.
These traders use several strategies. Some use intraday indicators like the Volume Weighted Average Price (VWAP) to map entry and exit positions. Others identify chart patterns like triangles, wedges, and head and shoulders patterns. Others use candlestick patterns like doji, harami, and morning and evening stars.
Therefore, the ideal timeframes for scalpers range between 1 minute and 5 minutes.
Day traders
Scalping is a form of day trading. However, there are day traders who don’t rely on opening tens of trades per day. Instead, these ones do their analysis, identify patterns, execute trades, and then hold them for a few hours. They do this while avoiding leaving their trades open overnight because of the multiple risks associated with it.
These day traders focus on medium timeframes. They don’t use extremely short ones like those used by scalpers. Instead, most of them use charts that range from 10 to 30 minutes. The sweet spot in this strategy is about 15 minutes, as you can see below.
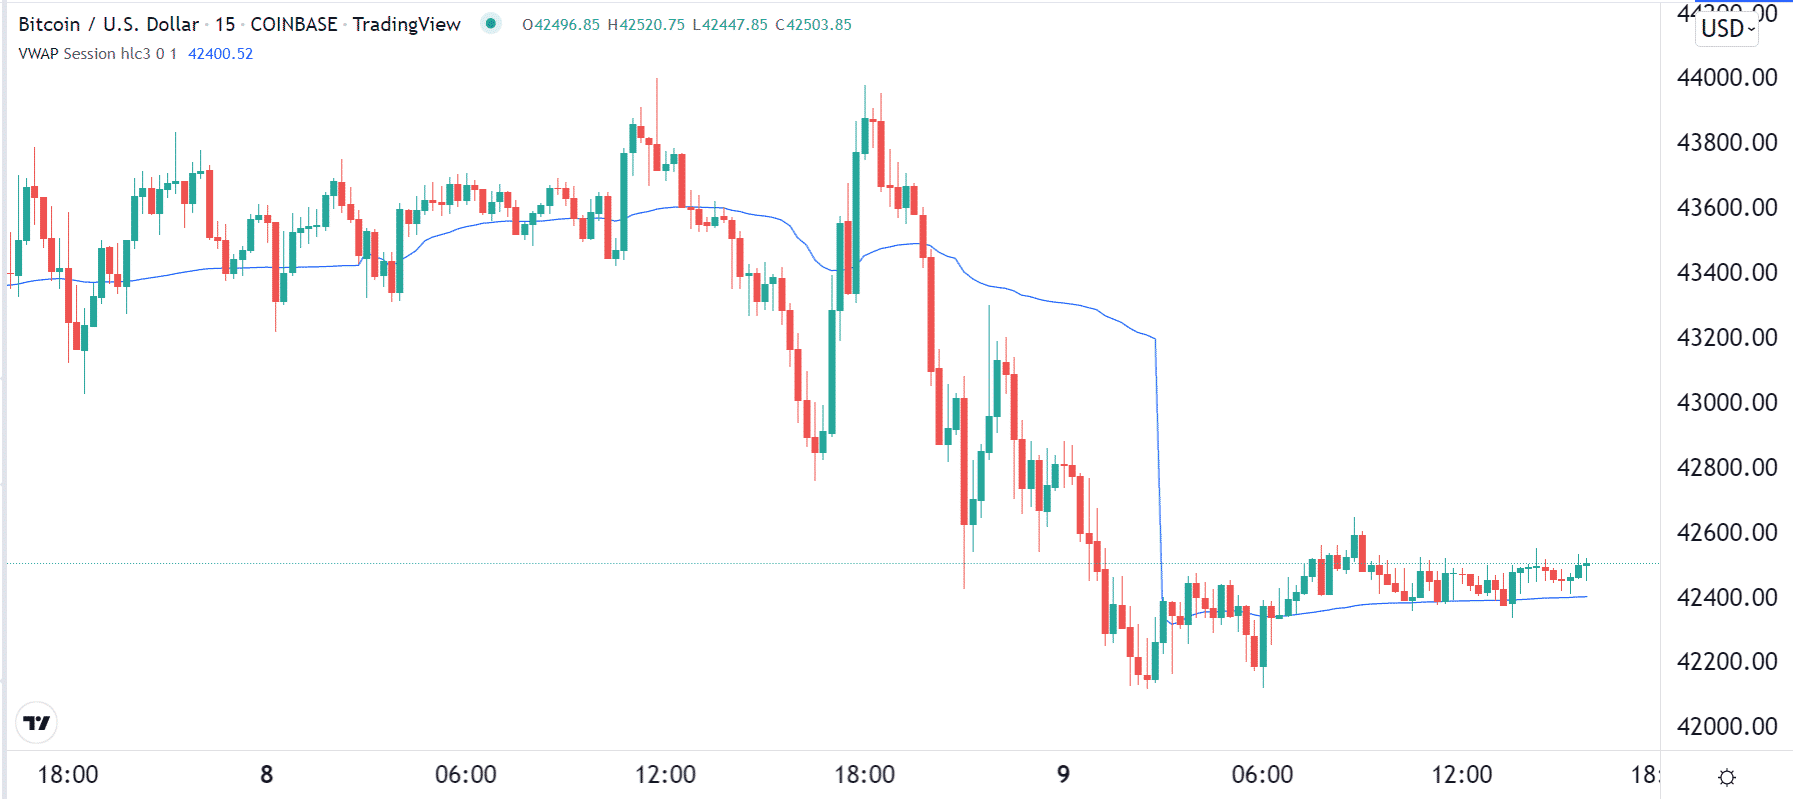
With a 15-minute chart, one can easily identify the overall trend of Bitcoin, execute a trade, and set stops. Some of the top strategies used in this strategy are using trend indicators like Moving Averages, VWAP, and Bollinger Bands. One can also trade reversals and continuations.
Swing traders
Swing trading is a thematic trading approach where a trader seeks to identify long-term trends and follow them for a while. In most cases, a swing trader tends to hold a position for two to three days.
For these traders, extremely short-term timeframes cannot work well. For one, a one-minute chart can show that Bitcoin’s price is rising while a longer one shows that it is falling.
While swing traders are different, most of them use 30-minute or hourly charts to analyze and execute trades. These participants use several approaches. For example, there are those who focus on trend continuation, where they identify a trend and follow it.
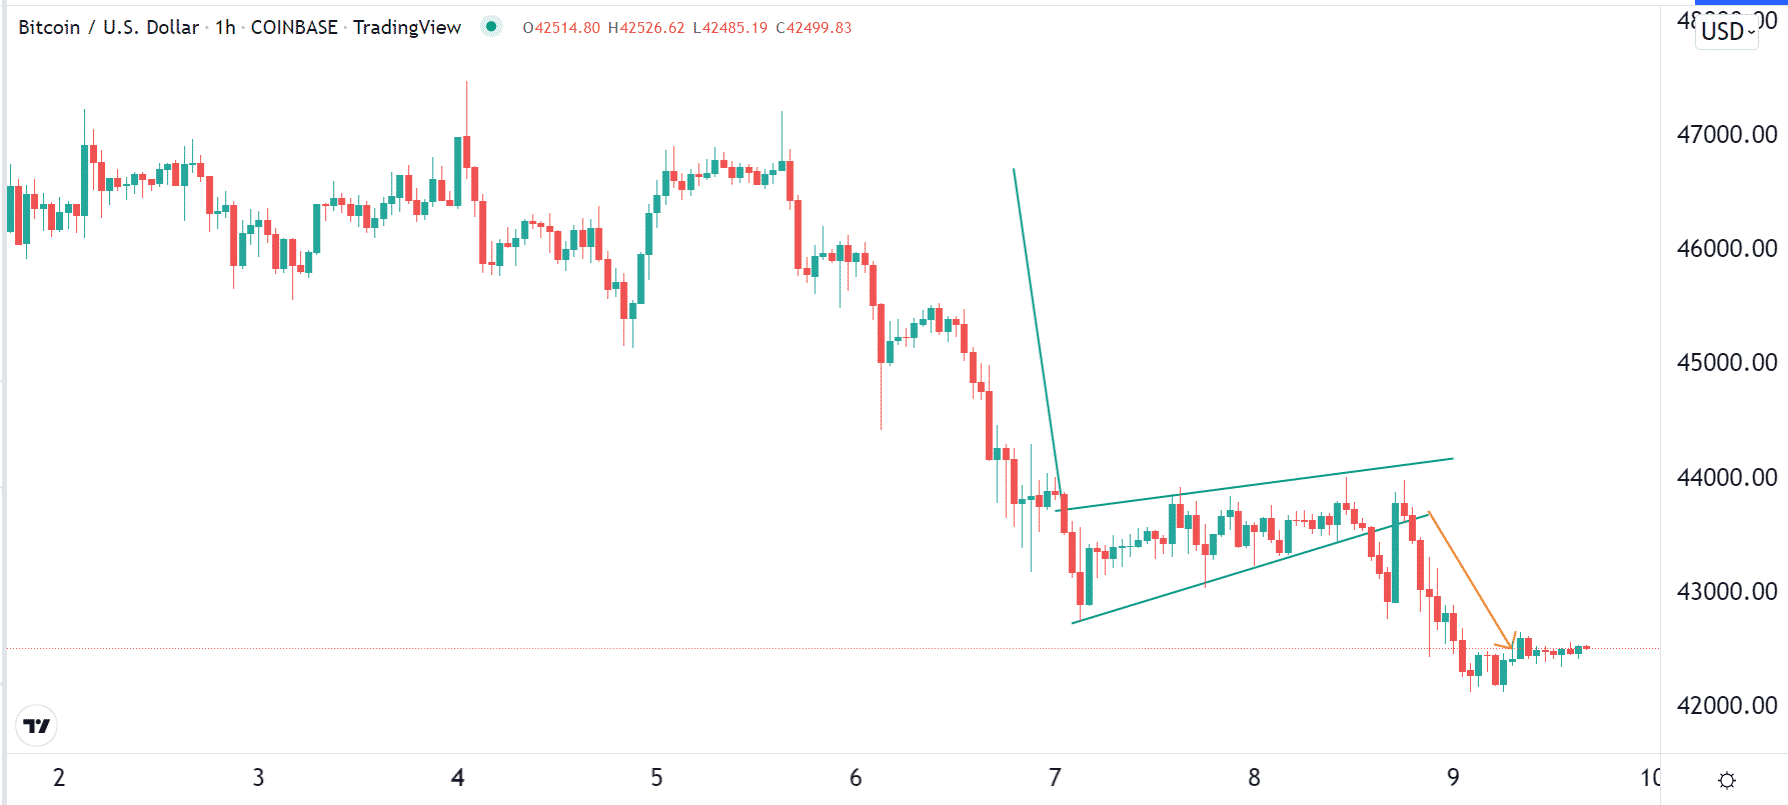
Others use chart patterns like rectangles, pennants, and flags to determine whether to buy or sell Bitcoin. For example, in the hourly chart below, we see that Bitcoin formed a bearish flag pattern that is shown in green. Therefore, this is a sign that the coin will break out lower soon. As such, a swing trader could short Bitcoin and just wait for a few days.
Therefore, the best timeframes for a swing trader range from 30-minutes to 1-hour.
Position traders
Position traders are also known as investors. These are people who focus on the long-term. As such, they are not concerned about how Bitcoin will trade in the following minute or hours. Their goal is to identify trading patterns, execute trades, and hold them for a few weeks or even months.
These traders mostly focus on longer timeframes depending on the amount of time they intend to hold their positions. For example, a trader looking to hold a trade for a month could use a daily chart, while the one seeing to hold for a few months could use a weekly one.
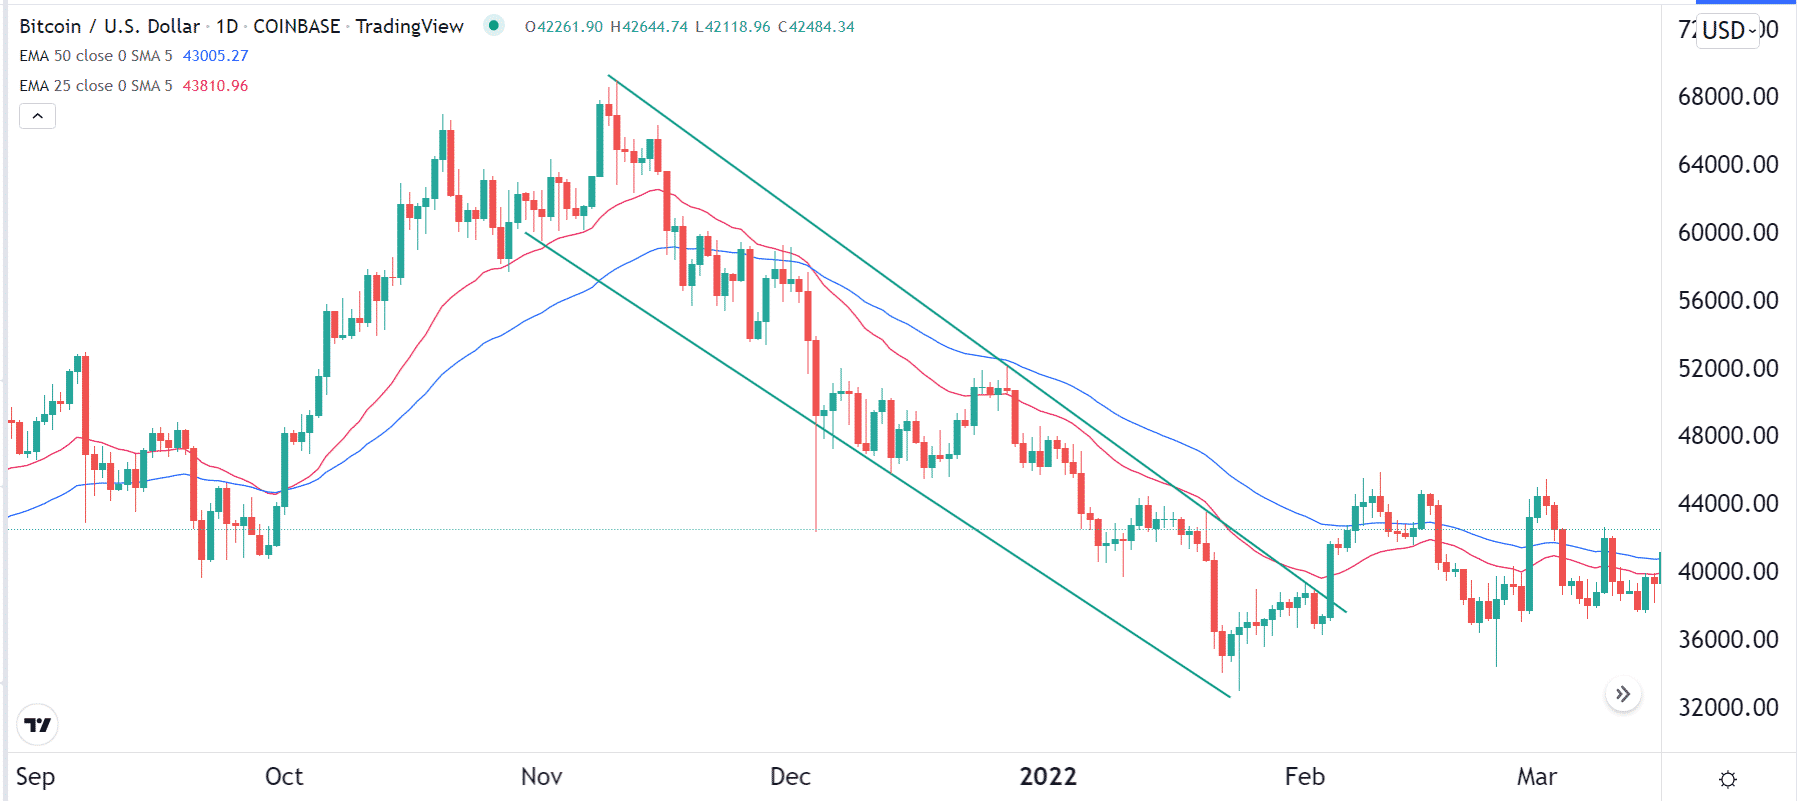
A good example of a position trade is shown above. In this case, the trader could have placed a short trade when the daily candle closed below the red or blue EMA and held it for a few months.
Summary
Therefore, in conclusion, the answer to the question of the best timeframe to trade Bitcoin is that it depends. If you are a scalper, we recommend that you focus on a chart that is less than 10 minutes long. For day traders, use charts less than 30 minutes and if you are a position trader, use a daily or weekly chart.