Cryptocurrency has established an asset market that never closes, and investors can trade at any time of day or night because it is based on the internet. This round-the-clock accessibility provides investors with numerous opportunities to profit. On the other hand, many others find trading cryptocurrency every day to be tiresome and unpleasant. Long-term investing, on the other hand, can be a little sluggish. As a result, many investors use a strategy known as swing trading. It is popular among crypto traders of all levels of experience. There are some indicators that are particularly well suited to it, and we’ll go through them in this article.
Definition
Swing trading is a style that focuses on capturing price changes that occur over a short to medium time frame. It is based on capturing market swings that last a few days to many weeks. The strategies work best in trending markets. Opportunities can be available during a higher time period with a strong trend, and swing traders can profit from larger price swings. It is more difficult in a consolidating market. After all, capturing major price moves is more difficult in a sideways market.
Swing traders, like day traders, look for opportunities to benefit from both uptrends and downtrends.

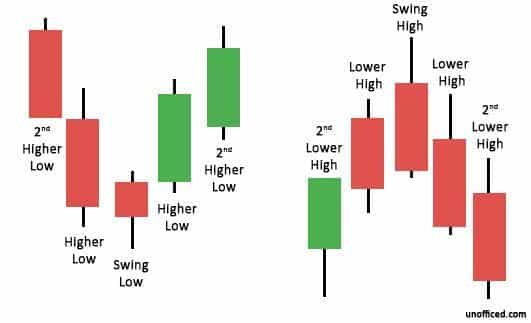
A swing low occurs when a price makes a low that is quickly followed by two higher lows (see the image below). In contrast, a swing high happens when the price makes a high, followed by two lower highs.
Ease of movement (EMV)
It shows the relationship between the rate of change in a crypto’s price and its volume. It’s most common on the daily chart and in longer periods. The EMV fluctuates above and below a zero line. This is done in order to quantify the “ease” of price movements.
When it rises above zero, the market’s price rises with relative ease, and the greater the EMV rise, the faster the price will rise. When the EMV falls below zero, the market falls with increasing ease.
Relative Strength Index (RSI)
The tool is commonly used to highlight possible oscillations within a larger trend. It is used for determining if a market is overbought or oversold and thus whether a swing is likely. Over a period of time, the RSI counts the number of positive and negative closes in a market (usually 14).
An oscillator, a chart that starts at 0 and ends at 100, is used to illustrate it. Anything over 70 is considered overbought, indicating the beginning of a short trade. Meanwhile, the RSI is considered oversold when it falls below 30. This is often seen as a sign to go long. If a market is in an uptrend, but the RSI rises above 70, the market could turn bearish. However, if the RSI stays low, the trend may continue.
Moving Average (MA)
There are two types of MA, Simple Moving Averages, which average all of a period’s closing prices, and Exponential Moving Averages, which give greater weight to the price that is closest to the present date.
The indicator is used when there is an MA crossover, i.e., a short-term MA crosses a longer-term MA, suggesting a change in momentum. A bull move is indicated when a fast MA crosses a slower MA from below. When a faster MA crosses a slower one from above, the momentum is likely to become bearish.
Volume
This indicator gives some insight into the strength of a new trend. A high-volume trend will outperform one with a low-volume trend. When there is more trading, the basis for price activity becomes more substantial.
According to the rule of thumb, when the crypto’s price rises in a positive market, there should also be an increase in volume, indicating the presence of actual buyers. A price adjustment that isn’t accompanied by a volume shift isn’t considered a change of trend.
The market frequently experiences a rise in volume before a trend reversal. Traders look for price drops versus volume to signal a bullish trend via volume divergence. They look for two price drops that are weaker than the first and come with lower volume increases. This implies that negative momentum diminishes as sellers fail to push the market below the initial drop.
Stochastic indicator
It compares the closing price to its price range over a given time period. On a chart, it is displayed with a range of 0 to 100. A value of more than 80 is considered overbought, while a reading of less than 20 is considered oversold.
There are two lines on the indicator. The current value of the oscillator is shown on one, while a three-day Moving Average is shown on the other. Strong trends can last long in either region, so an overbought or oversold signal doesn’t automatically mean a reversal is on the way. As a result, many traders watch for when the two lines of a stochastic oscillator cross, interpreting this as a sign that a reversal is on the way.
Summary
Swing trading is a well-known strategy in crypto. Swing traders may often stay in positions for a few days or weeks, depending on the trade setup. Before you begin, it may be beneficial to understand risk management fundamentals such as employing a stop loss and suitable position size strategies. The indicators mentioned above are the most common ones used to analyze cryptos and provide insight into how the price will move.
