The Stochastic Oscillator – What is it?
One of the most useful tools available for traders today. This is a momentum indicator. It is also a range-bound oscillator which is very useful for the traders.
What is the purpose of this oscillator? The oscillator works to make things easy for traders. It helps to compare a closing price on the asset. It compares this to the high-low range. Such a comparison is usually for a time. There is a default range as well which is 0-100. This is the default number.
Do many traders enquire if this oscillator is similar to others that are available? What is the difference between this from the others? Yes, this is different from the other oscillators we come across. This follows the speed & movement of the market. It does not consider the volume or price.
What Makes Stochastic Oscillator Unique?
This oscillator follows a different theory. It is based on the theory that the market momentum changes at a faster rate than a change in volume or price. Thus, predictions by this Stochastic Oscillator is accurate. Traders decisions if based on this oscillator can be correct. If this is used in the case of stock trading, it provides information on when the market is overbought or oversold sections. It does this by looking at the current price and comparing it to the price in the past or a “lookback” period.
The stochastic oscillator, in that lookback period, is not just comparing the price to previous price levels but is also factoring in the highest high and the lowest low across the lookback period in which it is making the comparison. The value of this oscillator is bounded between 0 & 100.
How Does It Work?
The Stochastic oscillator appears like other oscillators and plots two lines on a chart. The first line is called %K, while the second line is %D. The default overbought region is any reading higher than 80, while the default oversold region is any value below 20. The two lines follow each other quite closely with instances of occasional crossovers.
For Trading Stocks
There are a number of different ways in which the stochastic oscillator can be used. The most common ways include:
- Using it to just to indicate overbought and oversold regions and using those as indications of potential reversals in price
- Using it to look for crossovers of the two lines (%K and %D) and use those as trading signals.
- Divergences between price and the stochastic oscillator
Overbought and Oversold regions
Focusing solely on overbought and oversold regions is a very basic usage of the stochastic oscillator. It’s as simple as seeing the oscillator move into the overbought zone, which can be your preliminary warning before dipping out of the overbought zone which is considered as a sell signal. Similarly, if the oscillator dips into the oversold region, it could be a preliminary warning of a possible bottom. Climbing back out of the oversold region could then be considered as a buy signal.
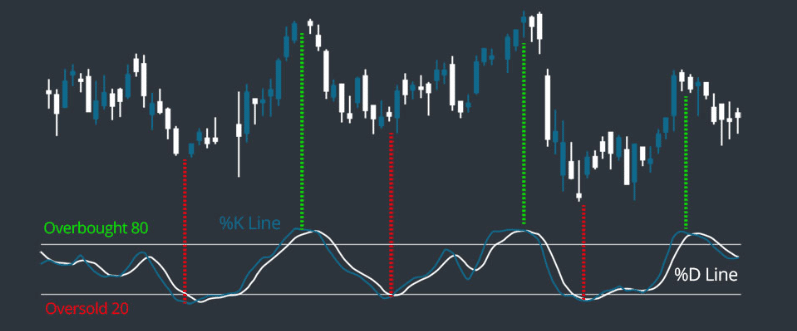
Crossovers as Signals
You can use crossovers as signals. The %K line crossing below the %D line would be a sell signal. The sell signal will be exactly at the point of intersection between the two lines. Similarly, the %K line crossing above the %D line would be a buy signal. In other words, a buy signal is indicated by an increase in price strength, while a sell signal is indicated by a decrease in price strength. You should remember that while trading stocks, some traders act just when they experience a crossover. This should not be done, as stochastics very often remain over-extended for an extended period of time before we can see a reversal.
How to Read the Stochastic Oscillator?
The oscillator is plotted within a range from 0-100, whereby 50 is the neutral level. Trigger levels are then added at 80 and 20. Here is the basic outlook for these readings.
| Level | Outlook |
| 0-20 | Overextended, very bearish |
| 30-50, and rising | Unwinding bearish configuration |
| 50-70 and rising | Bullish (increasingly) |
| 50-70 and falling | Unwinding bullish configuration |
| 30-50 and falling | Bearish (increasingly) |
| 80-100 | Overextended, very bullish |
Example of Trading with the Stochastic Oscillator
As an example, let’s take the FTSE 100 as an example. It’s a sideways trending market between a 6-month period from September to March (2013-2014).
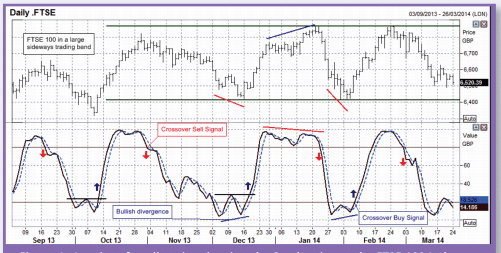
Here the FTSE 100 is trading in a sideways range. Notice that you will find 4 crossover sell signals here. The mainline crosses below the signal line. This warns you that the price’s upside potential is beginning to decrease. You will find the sell signal to trade on Sep 17, Nov 1, and Jan 22. The mainline then crosses back below the 80 levels on Feb 28. A bearish divergence followed this in January 2014.
You will tend to experience some false buy signals, as evidenced from the chart above in the months of October and December. However, in this case, it eventually proved to be correct. If we look at October however, we will find that the conviction behind the trade was heightened on the second crossover buy signal. This happened a week later. It was then subsequently confirmed by the move back up and above the initial reaction high. In December, the signal we see is actually part of a bullish divergence, which further adds to our conviction behind the signal.
Conclusion
Before implementing the stochastic oscillator in stock trading, you should be aware of some of the downsides as well. Firstly, when used individually, it tends to give out false overbought or oversold signals. Thus, you should never use it alone, instead, use it with another indicator to confirm your moves.
Secondly, the stochastic oscillator is not helpful for the identification of trends as well as for picking tops and bottoms. Lastly, the stochastic oscillator can give you premature exit signals. You should always look to apply stochastic in a slow-moving, trend, and not one which is very volatile with big candles.