
A stop order in stock trading is a type of market order to purchase or sell a security when its price moves past a particular point. This increases the likelihood of achieving a predetermined exit or entry price.
Stop orders can come in many different forms. But all of them have the same function – to be triggered whenever a predetermined price is reached in the future. However, the way each broker executes it will differ.
How Stop Orders Are Generally Used
Let us now see the main factors you should be aware of when using stop orders and how they connect.
Percentage figures
Traders use a percentage of the entire account size as a stop loss. Usually, this number can be from 2% to 5% of the overall account. This creates a problem for many serious traders in foreign exchange or futures trading, who have a trading account size of $10,000 or more. It means that per trade, the stop is $200 to $500. It leaves some room for mistakes. Generally, you may use at least a two-to-one risk/reward ratio on your trades. So, if you risk 5% on a $10,000 account, you may expect to risk $500 and make $1000 per trade.
Dollar limits
You can set stops according to a dollar amount per position. The amount of money is categorized under money management for trading systems. If you risk $250 per futures contract in an e-mini S&P contract, then you must place the stop level at a 5-point distance from your entry point. Professional traders do not use this method much because it does not have any relevance to a mechanical trading model, especially those systems that are always in the market, like a moving average system.
However, when it comes to active day traders, this feature is beneficial for setting a daily sum in dollars on a loss limit. You can set a daily loss limit on some electronic order platforms. It sets an overall loss limit on the trading account rather than setting a stop loss per trade.
Price levels
Traders frequently use basic statistics for measuring the degree of price volatility occurring on a regular basis in a given market. You can then use these measures for placing a stop order or a limit order that takes these natural daily price movements into account. Statistics usually used are the standard deviation, the mean, and the coefficient of variation. Many technicians have explored the best trailing-stop approach. Several methods include using a set price amount to place a stop that can be up to 50% of the true average range for a given period, either above or below the ten or twenty days’ moving average.
This method is very informative. If a stop is placed near a certain chart point of interest like an old high or an old low, the level is obvious to each chart watcher. Markets test and penetrate those levels from time to time. If the stop is set too close, like setting a buy stop above an old price high or a sell stop below an old low point, your orders have the chance to be executed if it is too close, such as the shooting star or jackhammer represents.
So, usually, you can calculate a specific factor or distance for your stop placement. Since most traders trust that a market has reached a peak, they place the stop slightly below an old low or above an old high. Based on where you place your stop, the market demonstrates a spike pattern that hits your order and then proceeds towards the desired direction without you.
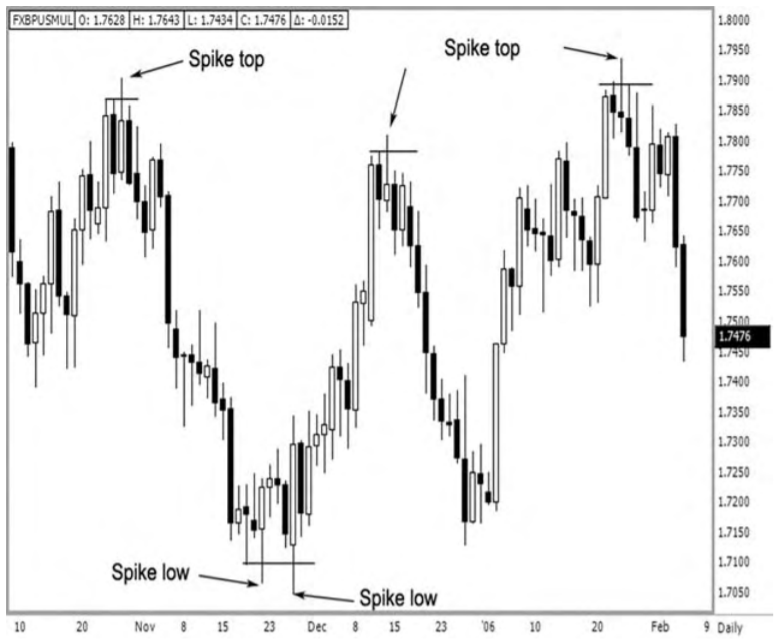
The figure above is an example of the market when it is at a major turning point, and a price spike occurs. You use the average daily range of the recent ten or more periods. Then, a factor between 20% and 50% of the ten days average daily range can be used. When you enter a short position, you may use a protective buy stop according to a percentage above the ten days average range.
Time factors
If the price does not move towards the predicted direction after a certain time period or the velocity of such a move does not warrant holding onto the position, then you must exit the trade. If you notice a High Close Doji (HCD) or a Low Close Doji (LCD) signal, the market usually reacts to it immediately within two or four time periods. If the market does not respond to this type of signal after a long period, liquidate the position. In this case, the timing of the trade did not correspond to the historical tendency; hence, it did not generate the expected results within the given period.
Another consideration for placing stops with time factors is the aid of a Moving Average (MA). An MA is a simple trend line that traders consider a time-driven price-direction tool. One time factor that can be used as a stop placement method is the crossover point of reference created using two moving average values. Once the shorter-term MA crosses the longer-term MA, a change of value in the market is reflected.
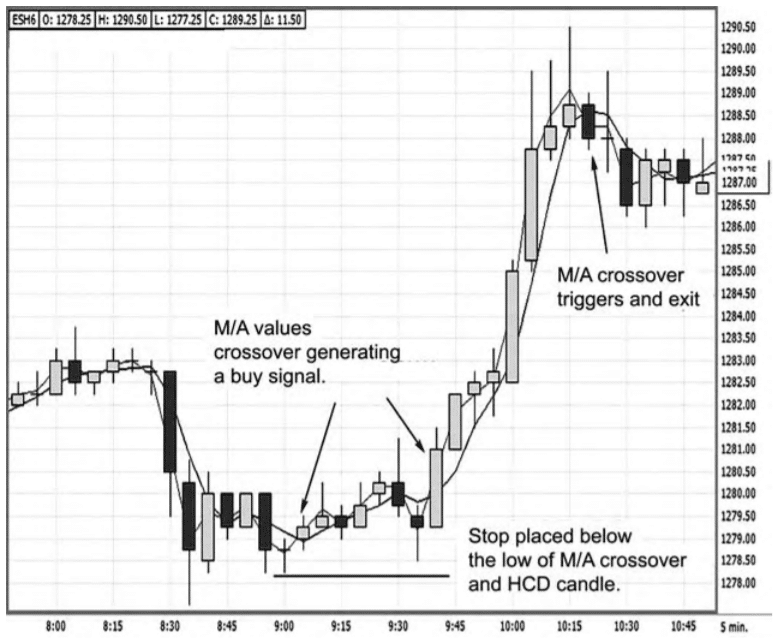
In the figure above, when the market triggers a signal to go long with the high close doji, a combination of low close doji and the crossover point can act as a stop placement level. You need to look at the point of crossover of the MA values.
If the market closes below the low doji and the MA values, that will warrant a trigger to exit the position. As you can see, a bullish trend is developed with the golden sequence of events, which are higher highs, higher lows, and higher closing highs. This stop-loss was placed at a critical point.
Conclusion
To determine when to exit a trade, you need to know when the market conditions change. If you remain in a trending condition for too long, you may overextend your welcome. Hence, tightening stops is a great method of protecting profits. After all, it makes a huge difference when you get out of the trade. It is common for traders to struggle with stop placements. There is no single method that can be called best. What you need to do is develop a consistent method to help you cut your losses and win more trades.