Cryptocurrency traders rely on various indicators to make entry and exit positions. Most of these tools are from a fundamental perspective, while others are based on technicals. By looking at them carefully, traders are able to decipher whether to buy or sell coins. This article will look at some of the top indicators that cryptocurrency traders use.
Fear and Greed indicator
The concepts of fear and greed always drive the cryptocurrency market. Ideally, investors tend to rush to cryptocurrencies when prices are doing well and sell when the situation reverses. This explains why digital coins like Bitcoin and Cardano surged to all-time highs in 2021.
At the time, most people were just buying coins without doing any research about them or even knowing what they do. The opposite usually happens when cryptocurrency prices start underperforming. During this time, most people who bought at the climb tend to exit their positions.
The first fear and greed index was created by CNN Money and is mostly used to guide stock investors. It is calculated using several other sub-indexes like VIX, safe-haven demand, junk bond demand, and market momentum.
Ideally, when there is a safe-haven demand, investors are fearful about the future. Alternatively, when there is a high demand for junk bonds, it is usually a sign that investors are embracing more risk.
Another fear and greed index usually focus on Bitcoin. It is comprised of several sub-index such as volatility, social media mentions, dominance, and trends. The volatility section looks at the overall drawdowns of the coin.
The BTC fear and greed index moves from 0 to 100, with 0 representing extreme fear and 100 – strong greed.
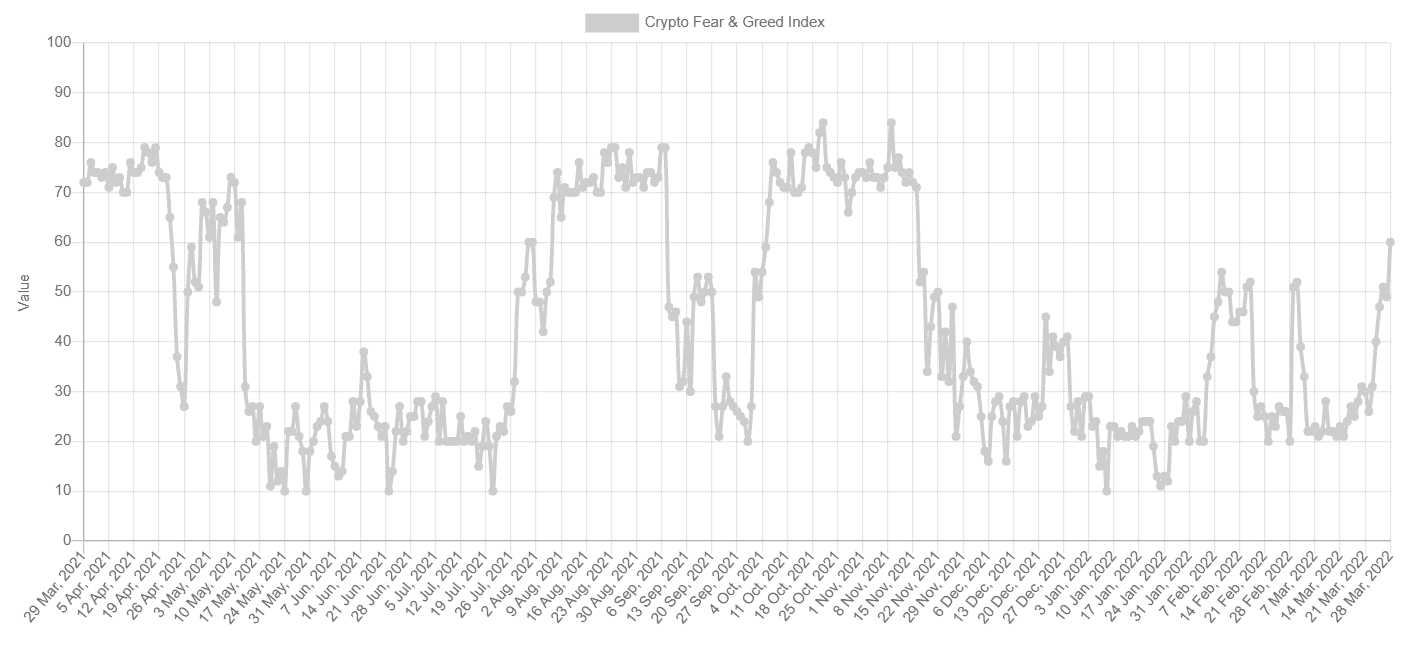
Therefore, traders look at where the indicator is and then decide whether to buy or sell a coin. A drop to extreme fear can lead to more purchases, while a climb to extreme greed can be a sign to sell. As shown above, the index jumped in May 2021 when most coins were rising.
CBOE volatility index
Another indicator that is widely used by cryptocurrency traders is the CBOE volatility index, commonly known as VIX.
This index uses options data from the S&P 500 index to gauge the overall sentiment among stock traders. It does not have an upper or lower limit.
The VIX tends to rise when there is substantial market volatility and then retreats when it cools down. For example, it rose sharply when the World Health Organization (WHO) declared Covid a global pandemic. It also rose when Russia invaded Ukraine.
While the VIX index was designed with stocks in mind, the reality is that it can be used in the cryptocurrency market. For one, it is the best-known measure of sentiment among investors. Most importantly, there is a good correlation between stocks and cryptocurrencies. In most cases, a jump in Bitcoin price is accompanied by a similar move in the Nasdaq 100 index.
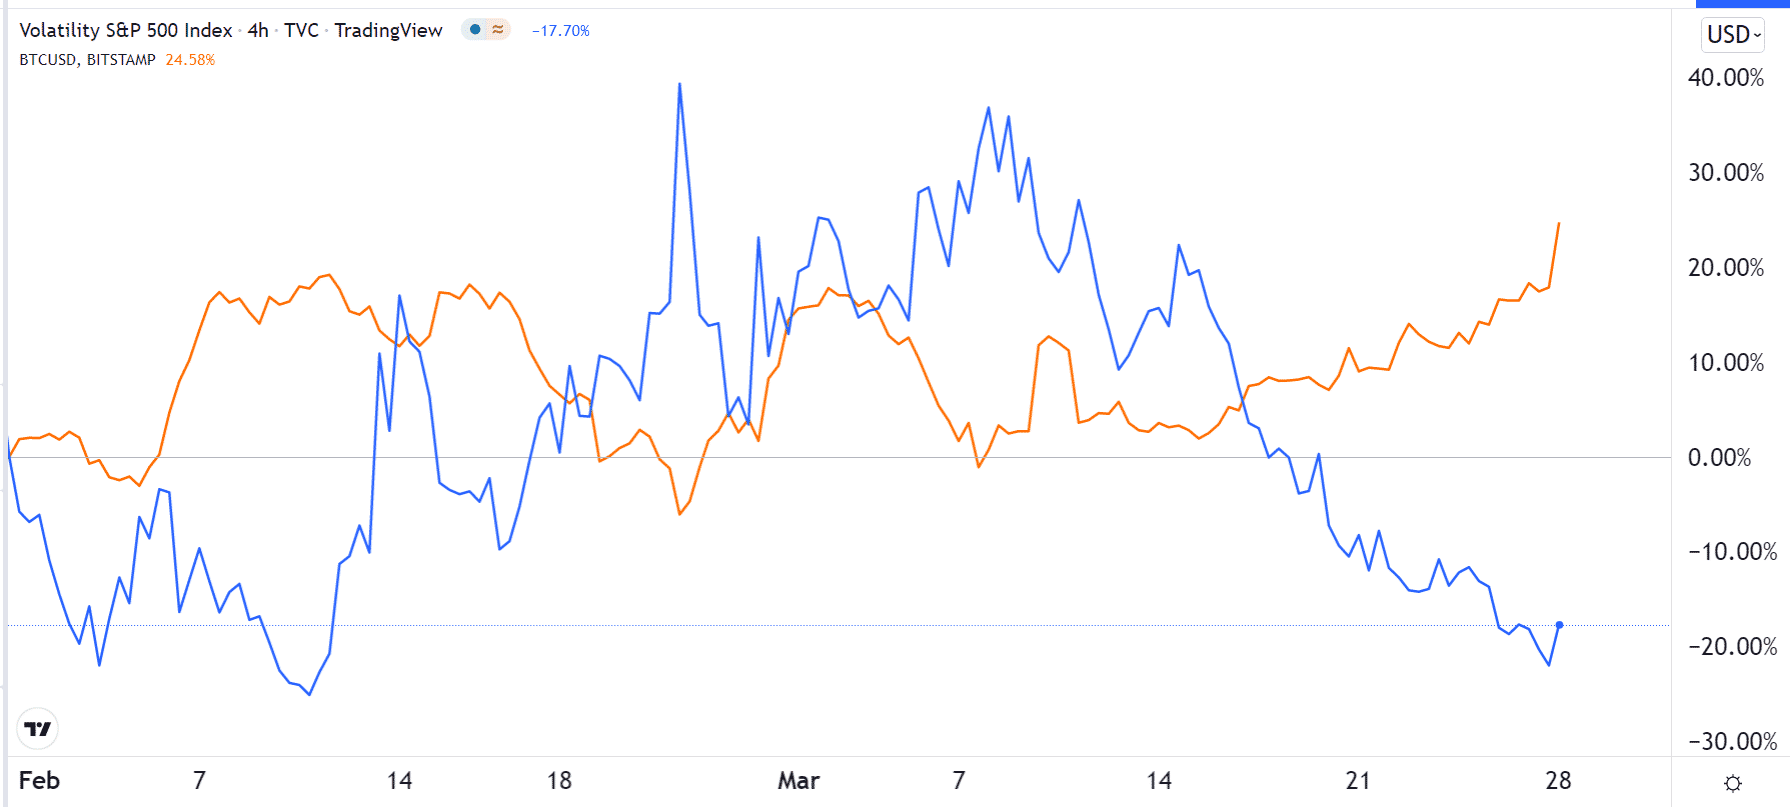
The chart above shows the relationship between Bitcoin and the VIX index.
Yield curve
The Federal Reserve is one of the most important players in the financial market. It has the mandate to lower and hike interest rates. Most importantly, it is the only organization that is given the mandate to print the US dollar.
Therefore, Bitcoin investors tend to look at the actions of the Fed and what to expect. For example, it is widely believed that the main reason why BTC and other coins did well during the Covid-19 pandemic was the Fed.
In its bid to protect the American economy, the bank decided to lower interest rates to zero and then print money using the quantitative easing strategy. As a result, its balance sheet rose from about $4 trillion in 2020 to over $9 trillion in 2021.
Therefore, Bitcoin investors look at the performance of the yield curve to predict what the bank will do. The yield curve is calculated by looking at the spread of the 10-year bond yield and the 2-year.
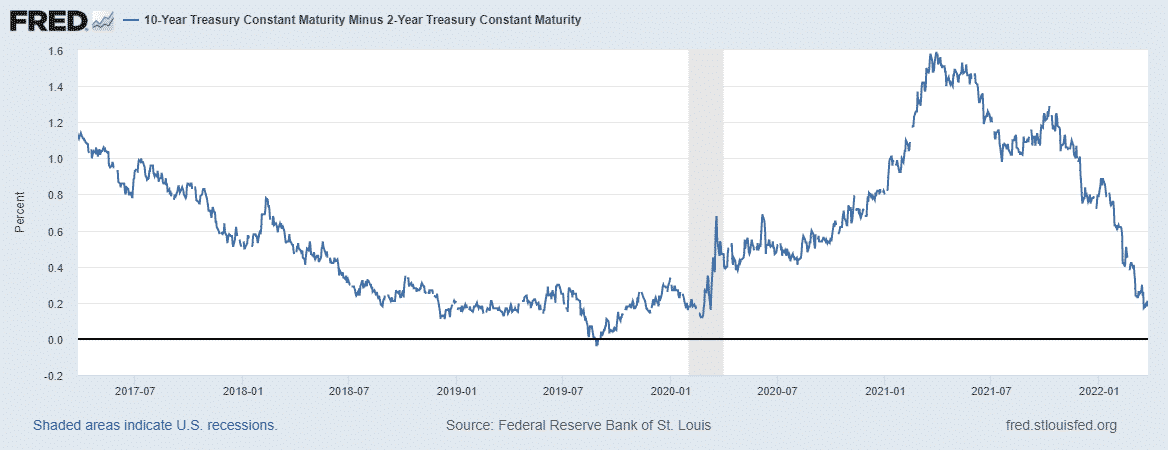
An inverted curve happens when investors fear that a recession is about to happen. As a result, the 2-year usually has a better yield than the 10-year. The normal curve happens when longer bonds have a better yield than the nearer ones. The chart above shows the yield curve chart.
Technical indicators
In addition to these fundamental indicators, traders use technical tools to analyze whether to buy or sell the coins.
There are hundreds of indicators, which are usually provided by most charting platforms like MetaTrader, TradingView, and NinjaTrader.
These tools are usually divided into several categories because of their use. First, there are trend indicators that are used to identify whether there is an existing trend or not. They can also be used to find reversals in the market. Their examples are Moving Averages, Envelopes, and Bollinger Bands.
Second, there are oscillators that show the state of a cryptocurrency. They are mostly used to identify overbought and oversold levels. When it is at an oversold level, it is a sign that the coin will likely bounce back. On the other hand, a bearish sign emerges when it moves to the overbought level. Examples of these indicators are the Relative Strength Index (RSI), MACD, and the Stochastic Oscillator, among others.
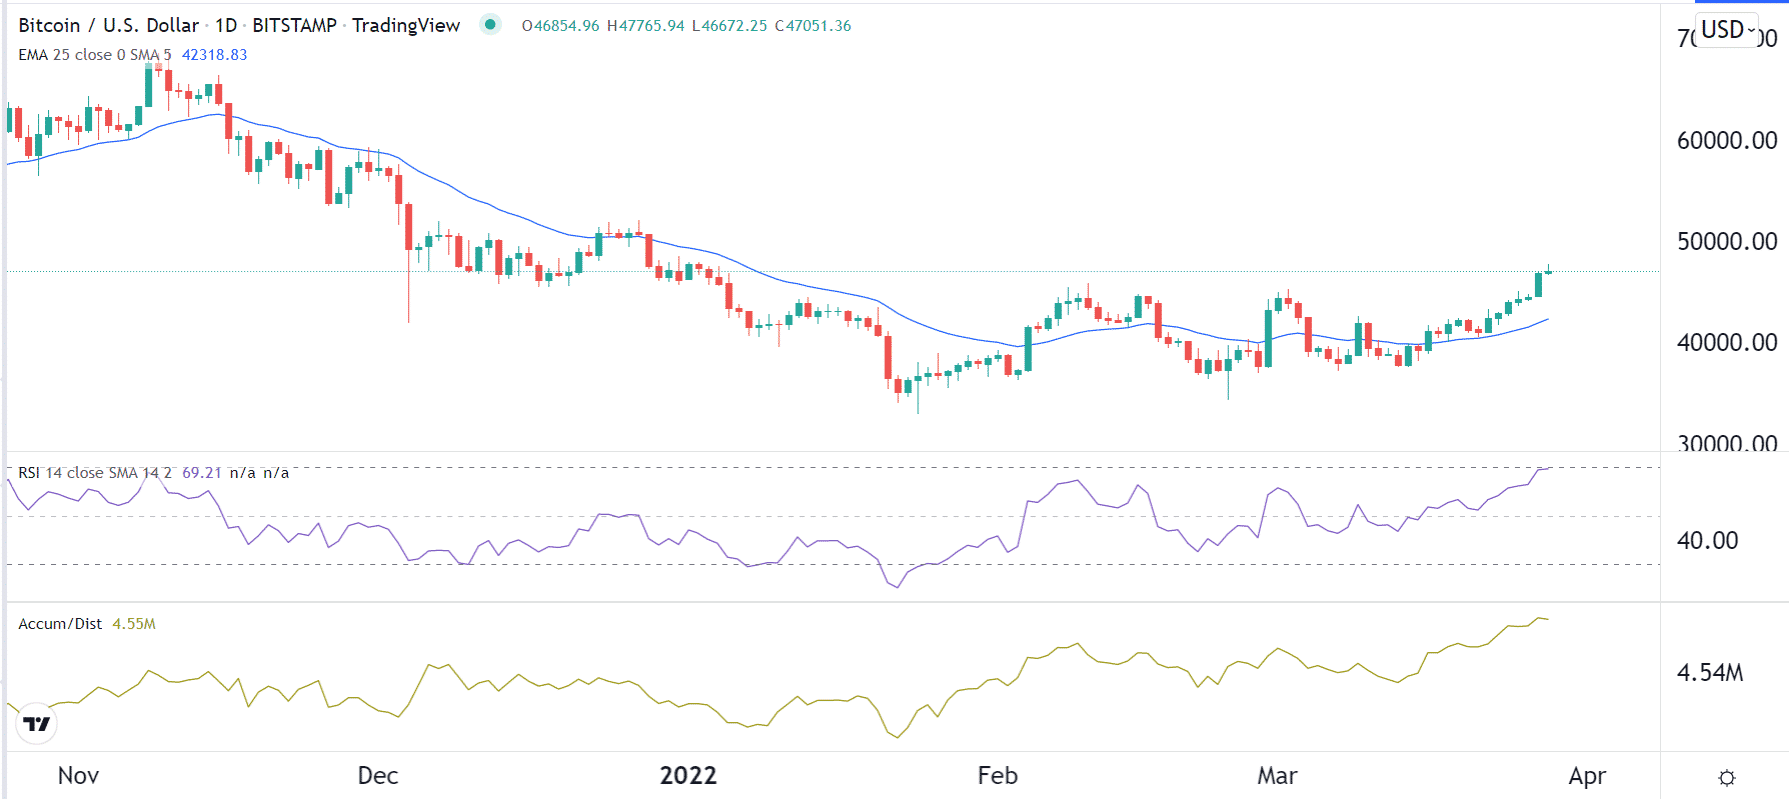
Third, there are volume indicators that look at the flow in and out of cryptocurrencies. Examples are the Smart Money Index and Accumulation and Distribution indicators. The chart below shows Bitcoin with a moving average (trend), RSI (oscillator), and Accumulation and Distribution (volume).
Summary
These indicators are important in helping cryptocurrency traders understand the current state of the market. They can also show the trader when to buy or sell the coins. Most importantly, they can also be applied to other assets like stocks and commodities.