
The MA is one of the most rudimentary tools, but its history of success makes it popular among beginner and expert traders alike. Most charting platforms will provide the MA, some even offering pre-installed templates that include different MA types. In this article, we shall explore how this tool works, how its signals are obtained, and compare its application across different financial markets.
What is an MA?
MA is an indicator that manifests as a line, which represents the average of all close prices over a specified period in the past. If you pick any specific point on this line, you can tell the average price over the last n periods and gauge how the current price compares to this average.
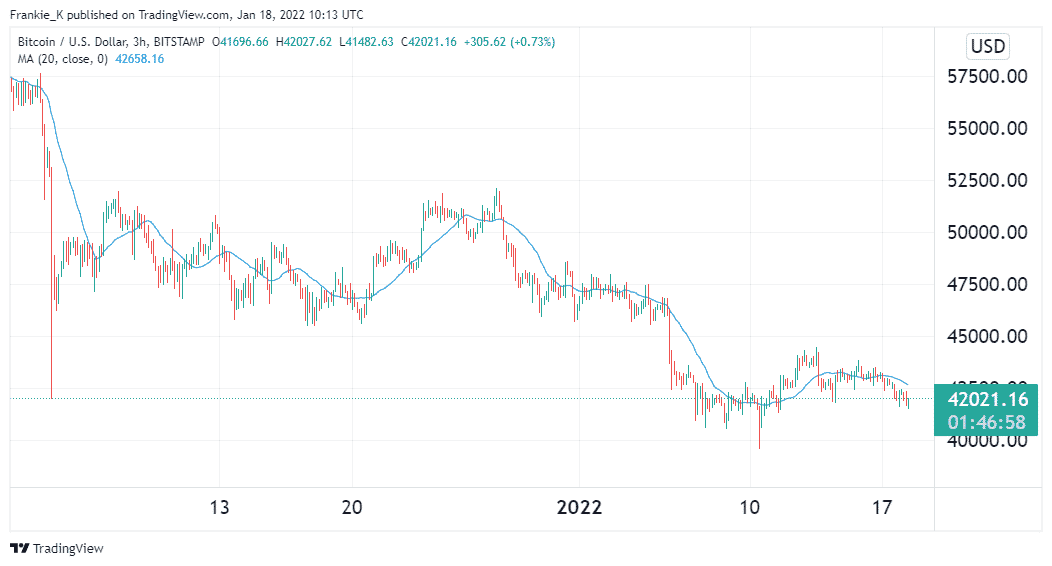
The above illustration shows a 20-period MA on a BTCUSD chart. From it, you can observe how the price fluctuates above and below this line. This yields different trading signals, as we shall look at a little further down the line.
How it is calculated
To obtain a Moving Average, you first have to set the number of periods you intend your MA to average prices over. For instance, let’s take TradingView’s default, 9 periods. If we are using a daily chart, the MA will be the sum of all closing prices over the last 9 days, divided by 9. You can always reduce this number to get a faster Moving Average or increase it to obtain a slower one.
The most common number of periods used is 20, 50, and 200 periods. The larger the period you use, the smoother the resulting line tends to be. This is because fluctuations in price will be less significant when divided by a large number of periods.
MA signal types
Levels of support/resistance
As aforementioned, prices will usually oscillate above and below a Moving Average line on a price chart. Oftentimes, when a market is trending, it tends to use this line as a support level, in the case of a market in an uptrend. In bearish market conditions, MA lines will often act as resistances.
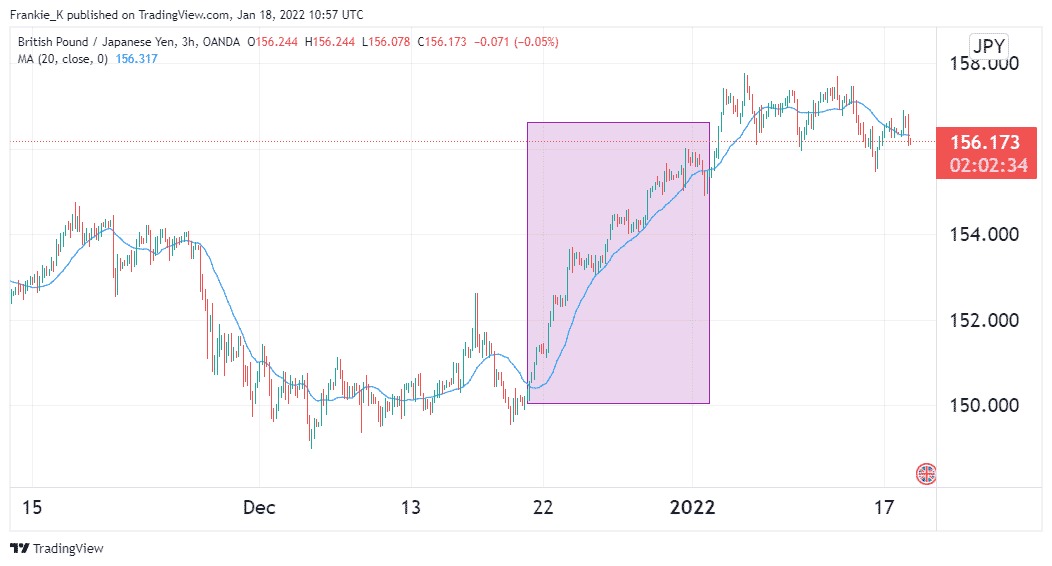
The image above shows an example of an MA acting as a support level. In the highlighted area, GBPJPY prices bounced off of the MA line as their rally persisted. This could signal an opportune entry for a long trade, with the exit signal coming as soon as prices break past this support level.
Breakouts
We have established that trending markets tend to render MAs as support or resistance levels. Once these trends exhaust their momentum, they will likely manifest as a break past this MA line. If the trend was bullish, for example, prices might break below the MA line that was acting as support, which may signify a bearish reversal. Similarly, bearish trends may stage an upward breakout and turn into rallies.
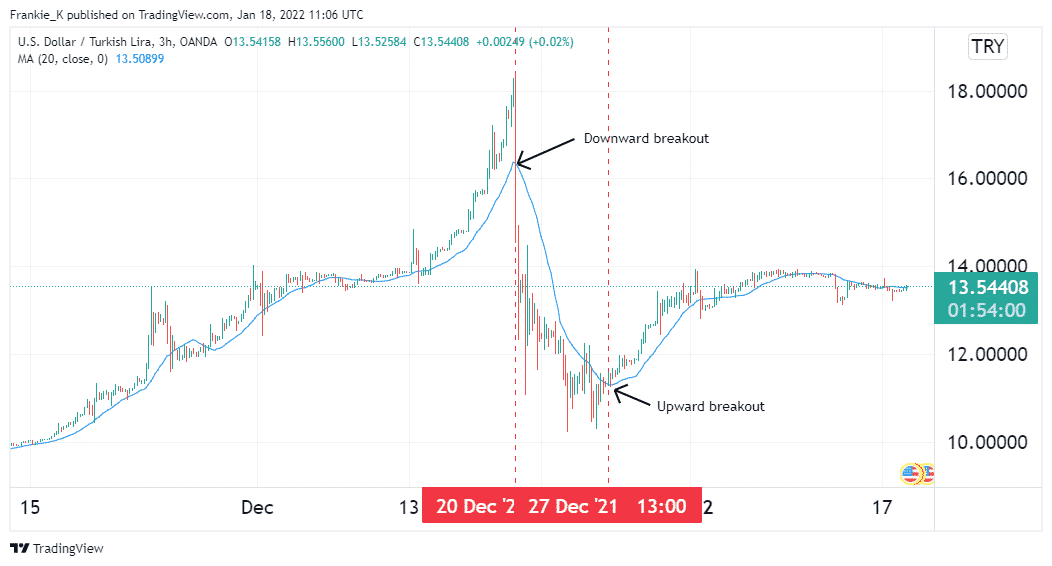
The illustration above shows the two types of breakouts from the MA line. On 20th December, USDTRY prices crossed below the MA line after a sustained rally. This marked the beginning of a bearish reversal. This trend lasted until 27th December, when prices broke out in the opposite direction, marking the beginning of a rally.
Crossovers
Here is the most common use case of MAs. It involves two Moving Averages, one of longer length than the other. When the shorter MA crosses above the longer one, it signals a market in an uptrend. Similarly, when the faster MA crosses below the slower one, it points to a market in decline.
Forex MA crossover strategy
In forex, most traders will use a 200 period or 250 period MA to highlight the major market trends in progress. To generate signals, they’ll utilize a shorter MA, such as the 50-period MA. When applied to a 3-hour USDCAD chart, for example, both lines will manifest as shown in the image below.
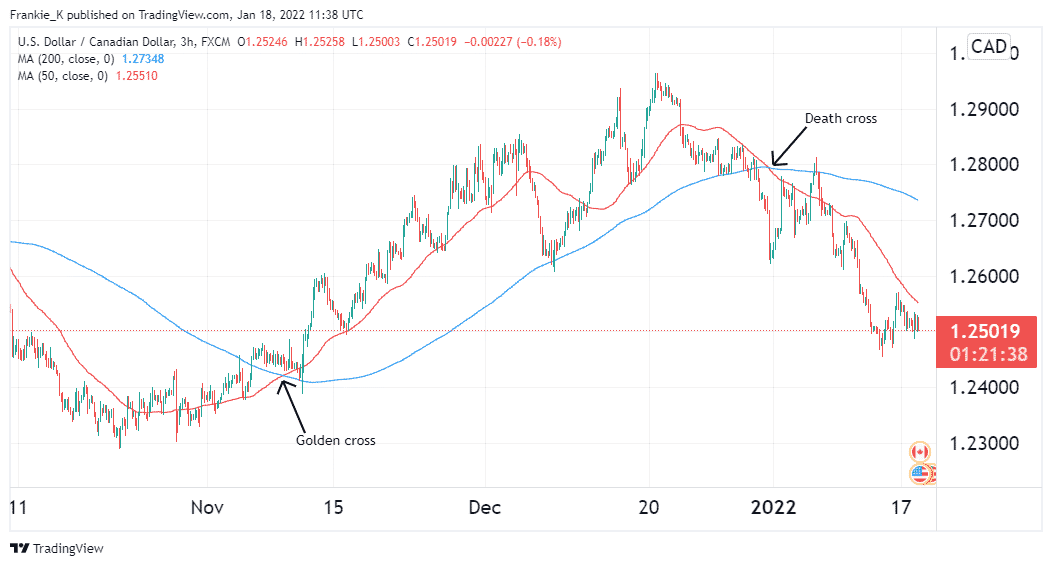
Observe the red 50 period MA breaking above its longer counterpart. This is called a golden cross, and it marks an opportune entry point for long trades. As predicted, the pair went on a steady rally, culminating in a bearish crossover at the beginning of 2022. This is called a death cross. It marks the exit point for all open long positions.
Crypto MA crossover strategy
The MA is a versatile tool that lends itself to all financial markets. As such, most strategies that work in the FX market will work on crypto price charts, albeit with minor adjustments. To that end, let’s demonstrate the crossover strategy in a crypto chart.
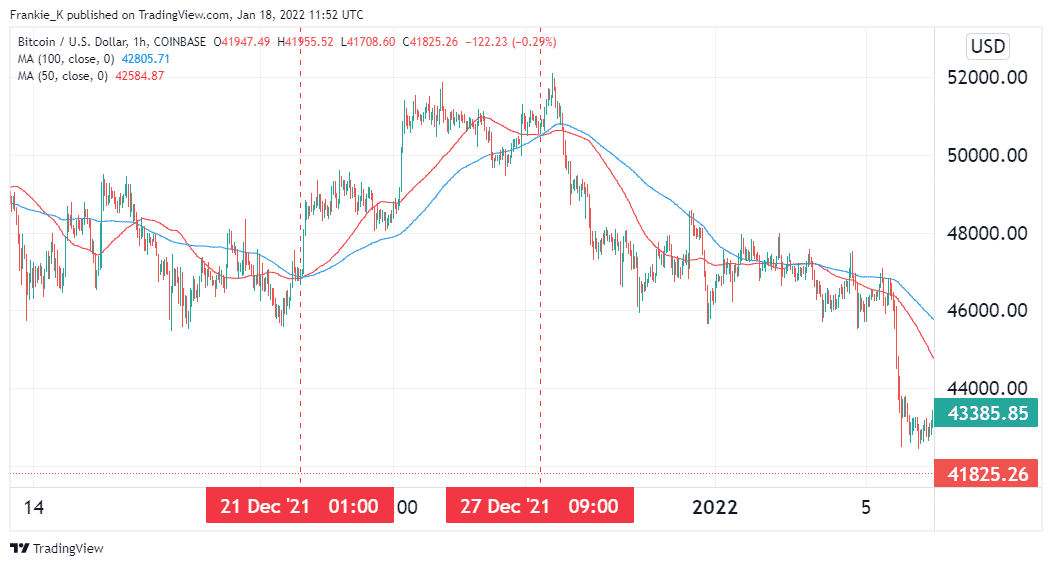
From the image above, we see a golden cross occur on 21st December, which implied that BTC prices were about to rally. True to that prediction, they went on an uptrend that lasted several hours. The trend reversed later that day, after the red 50-period MA crossed below its blue 100-period counterpart.
Therefore, the crossover strategy as applied to the crypto market is similar to that utilized for gauging trend reversals on forex pairs. Depending on your individual trading strategy, you may need to tweak the settings of both MAs, but the primary premise behind the strategy remains the same.
Shortcomings of the crossovers
Since MAs are calculated from historical prices, they are a lagging indicator. As such, any signals they generate tend to lag price movements. Crossover signals, in particular, tend to happen after the trend reversal has already begun. The longer the period you use, the farther the signals you obtain tend to lag behind price action. Therefore, short-term MAs such as the 10-period and 5-period are best suited for short-term trading, while longer-term MAs should be used to highlight levels of support and resistance.
Conclusion
The MA is a pretty straightforward indicator that averages prices over a specified period. By comparing the current prices to the average, one can tell which direction the market is trending. Signals from MA are obtained by using it as support or resistance, watching out for breakouts from these levels, and utilizing two MAs of different lengths to observe crossovers. These crossovers work for both forex and crypto markets. However, the MA is a lagging indicator, and thus its signals tend to lag behind prices.