
The RSI (Relative Strength Index) and MACD (Moving Average Convergence Divergence) are staples in the realm of indicators. These are two tools that virtually any new trader will be introduced to at the beginning of their trading career.
Both tools were built primarily to display momentum in the markets. Similar to physics, momentum is about the velocity of price movements. With this metric, traders are interested in the likelihood of price moving up or down and by how much force.
Ultimately, while the RSI and MACD are momentum tools, they perform this job quite distinctly. The RSI is primarily known as a reversal indicator, while the MACD is mainly used for entering into existing trends.
Nonetheless, let’s explore the basic construction of each indicator, tips on getting the best out of them, and whether one is considerably better than the other.
What is the RSI?
The RSI is one of the most popular indicators in the financial markets. It was created by the late J. Welles Wilder Jr., who published it in his influential 1978 book named ‘New Concepts in Technical Trading Systems.’
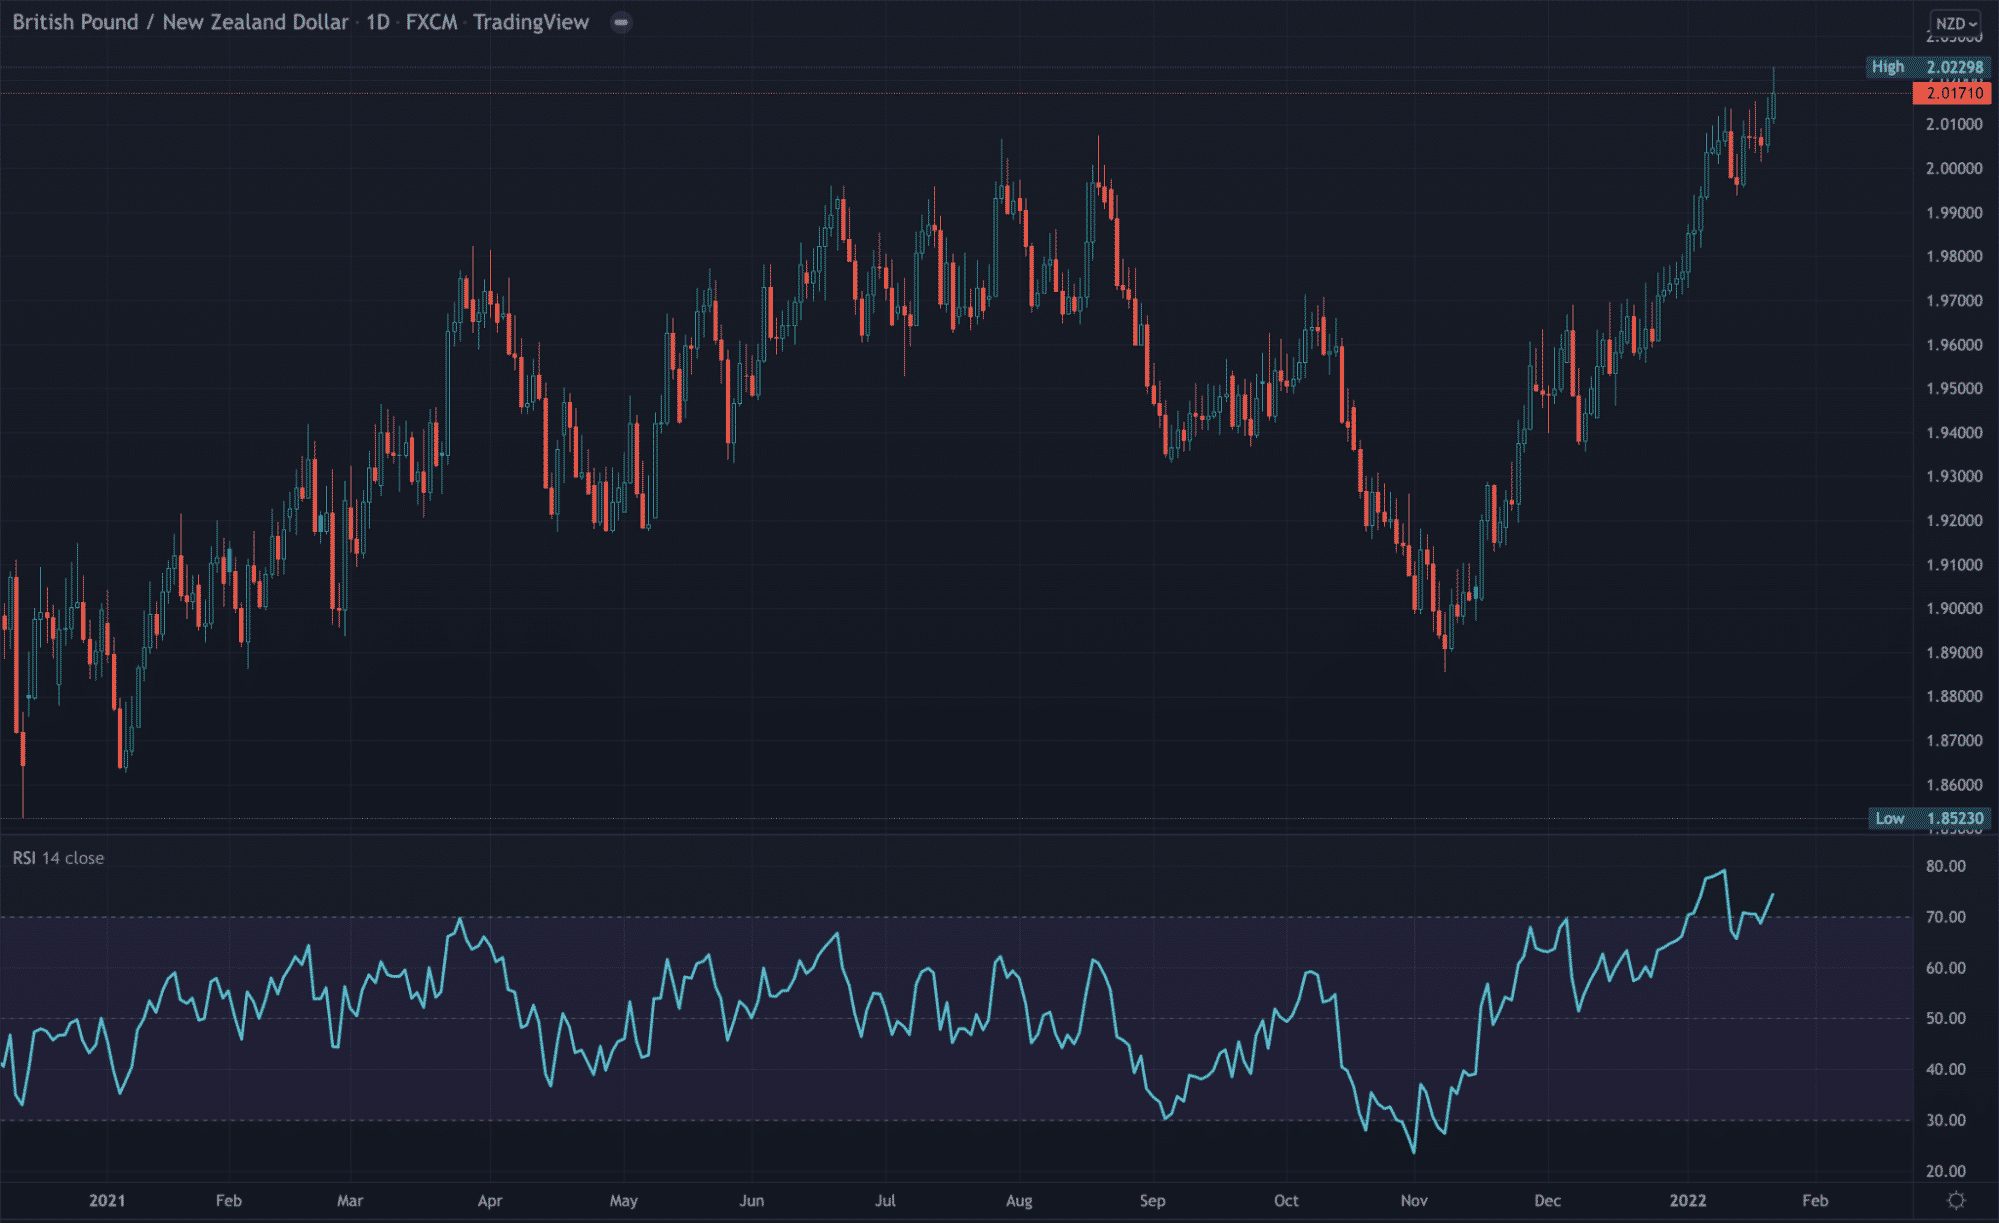
The RSI aims to chart the present and past strength or weakness of a particular market based on usually the closing price over a certain period (usually 14 days by default).
This data is plotted on a line graph oscillating between two extremes. The most significant readings for any given time frame are when it peaks below 30 or above 70.
The former is referred to as oversold, while the latter is regarded as overbought. When the RSI is above 70, it suggests that the growth is overextended with the expectation of a pullback to the downside.
Conversely, when the reading is below 30, it indicates very bearish momentum where traders anticipate a pullback to the upside. Some traders also consider the 50 line as a benchmark worth noting.
When the RSI crosses the 50 in an upward direction, traders expect the price to trend higher; on the other hand, they anticipate the price to trend lower when the RSI crosses this mark moving downwards.
Like most oscillators, divergence is a staple with the RSI and might arguably be the best indicator for using this technique.
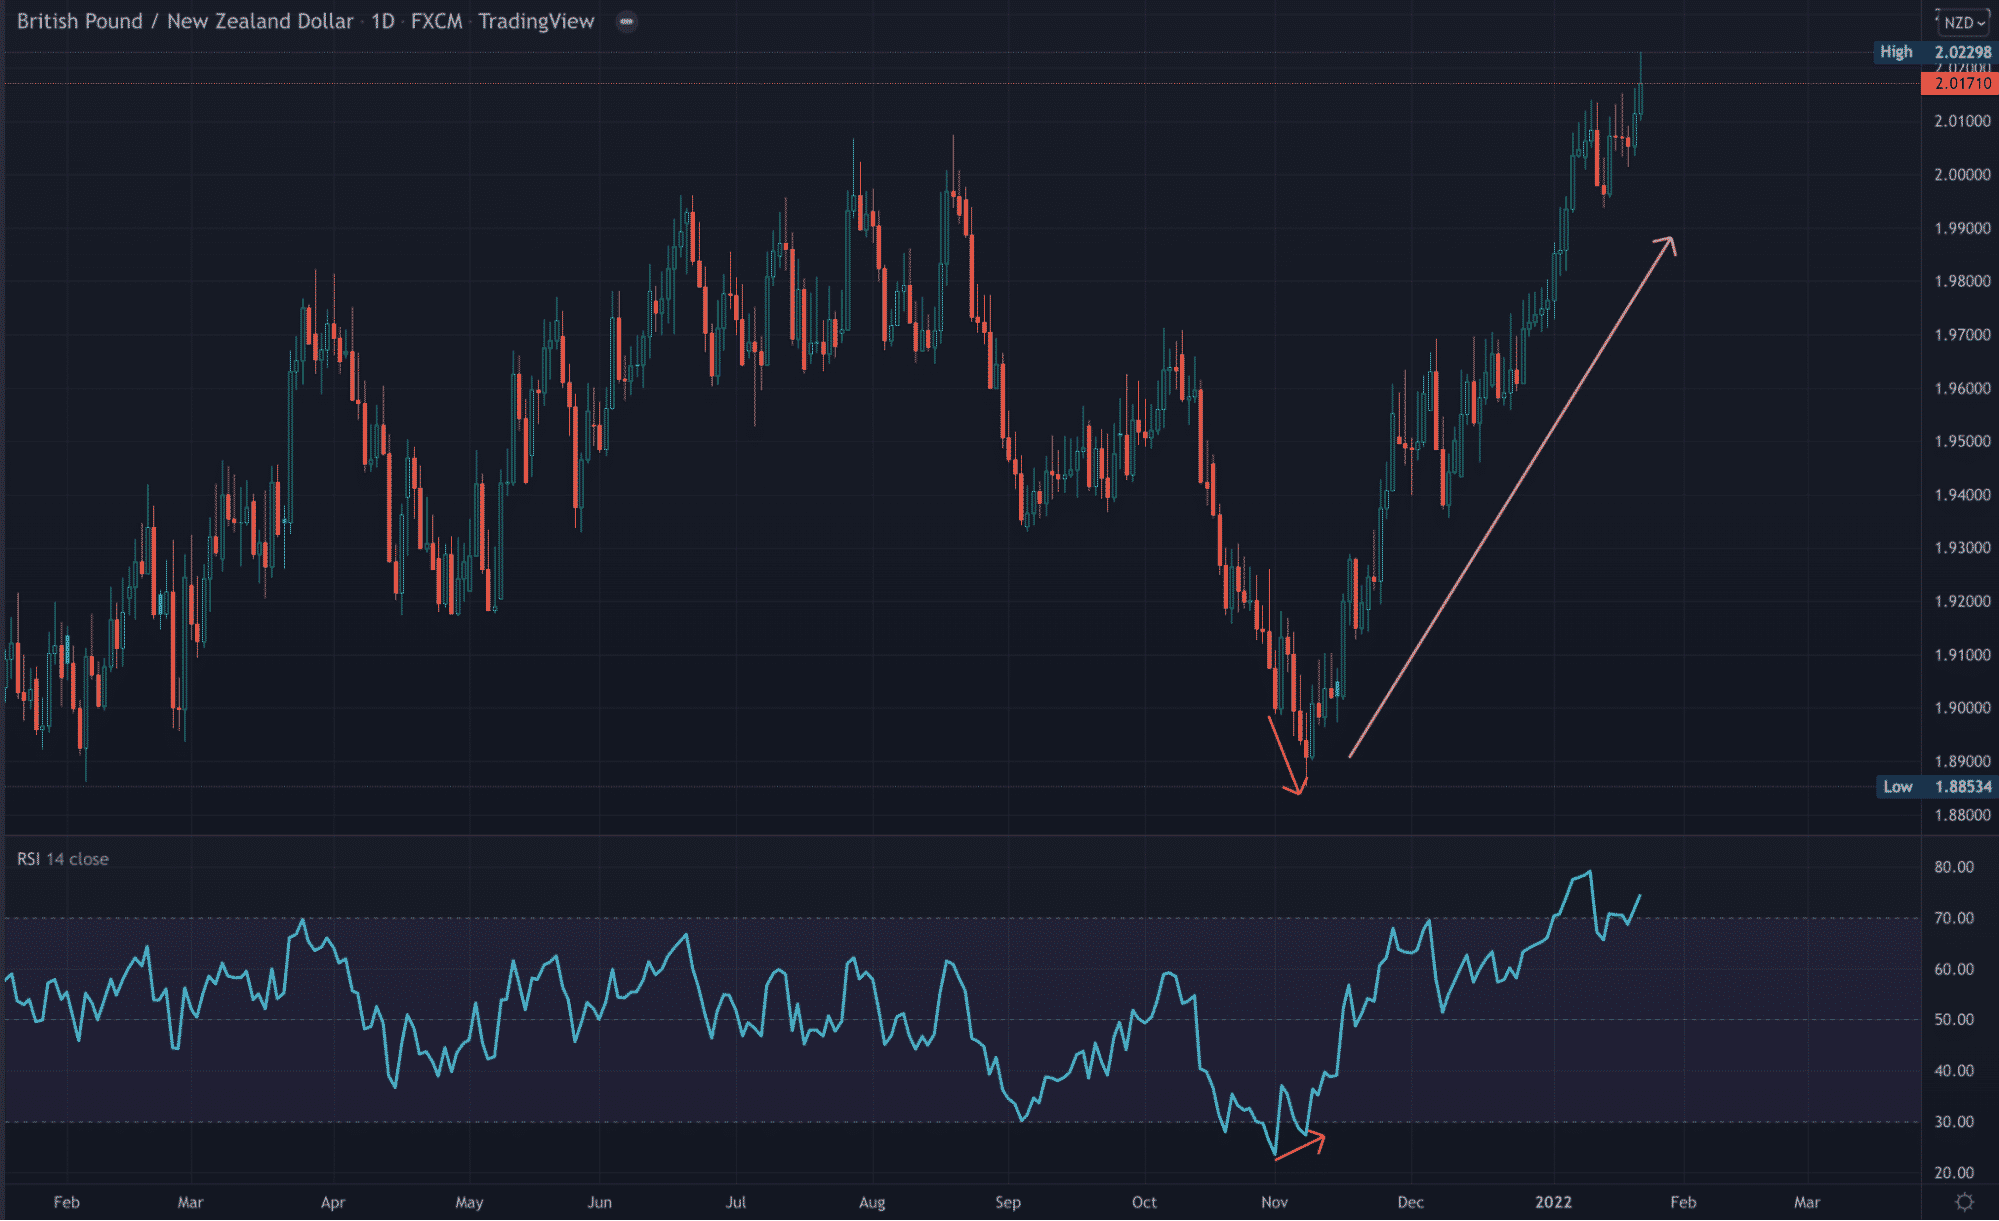
Of course, this happens when the market’s highs or lows show a mismatch against those on an indicator, suggesting an impending reversal.
What is the MACD?
While the RSI is purely momentum-based, experts consider its counterpart a trend and momentum-following indicator, making it more versatile. It was created by the legendary author Gerald Appel in 1979, making it almost as old as its counterpart.
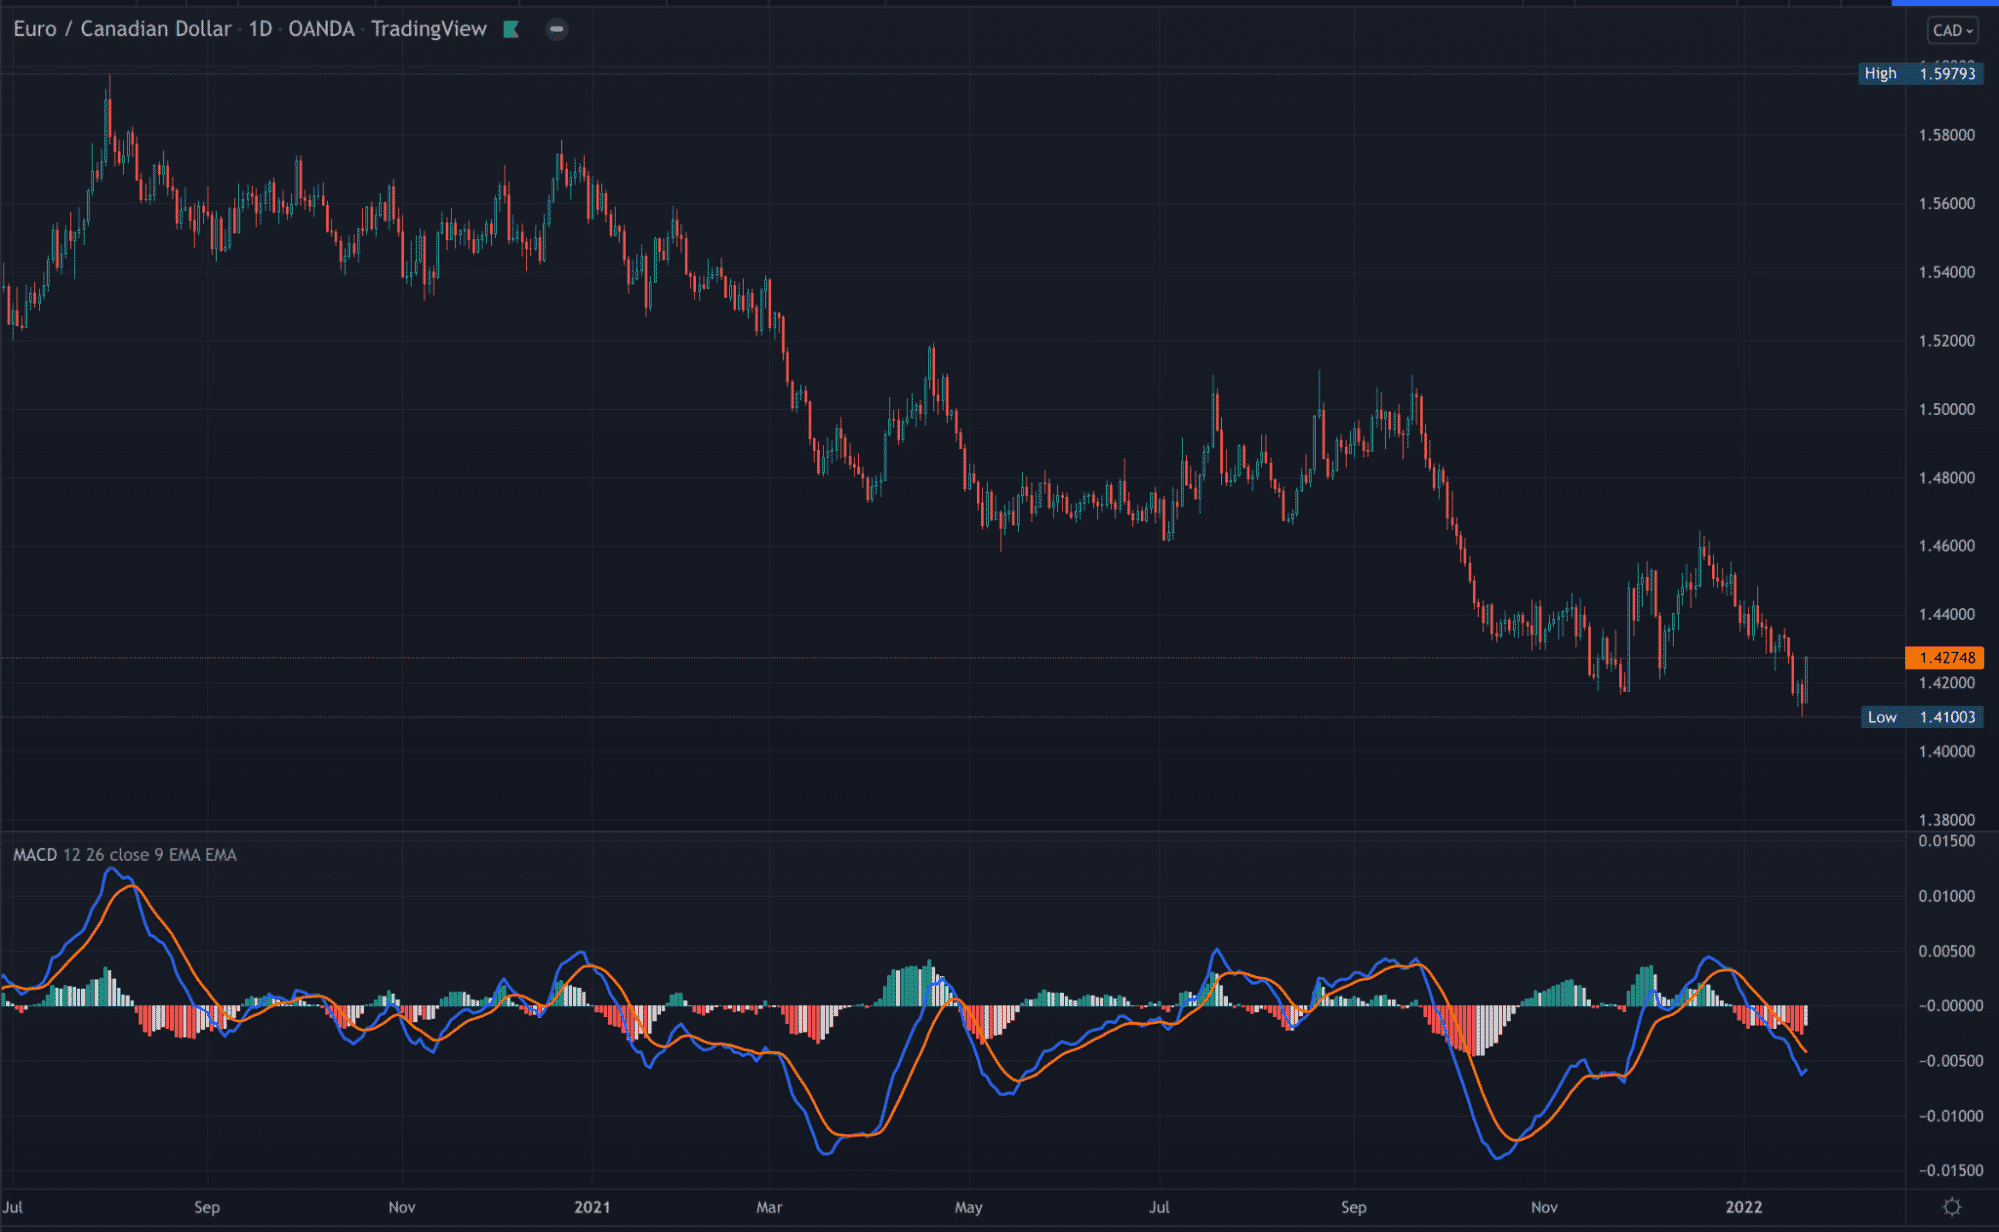
The MACD consistently shows the relationship between two Exponential Moving Averages (EMAs), usually a 26 EMA and a 12 EMA. This is referred to as the MACD line.
The second component is the signal line, which is typically a 9-period EMA. Unlike the RSI that uses a line graph, the MACD is plotted with a histogram mimicking the behavior between the MACD and signal lines around a zero line.
Traders use both these elements as triggers for going long or going short. When the MACD line crosses above the signal line, this is a bullish scenario; when the MACD line crosses below the signal line, this is regarded as a bearish moment.
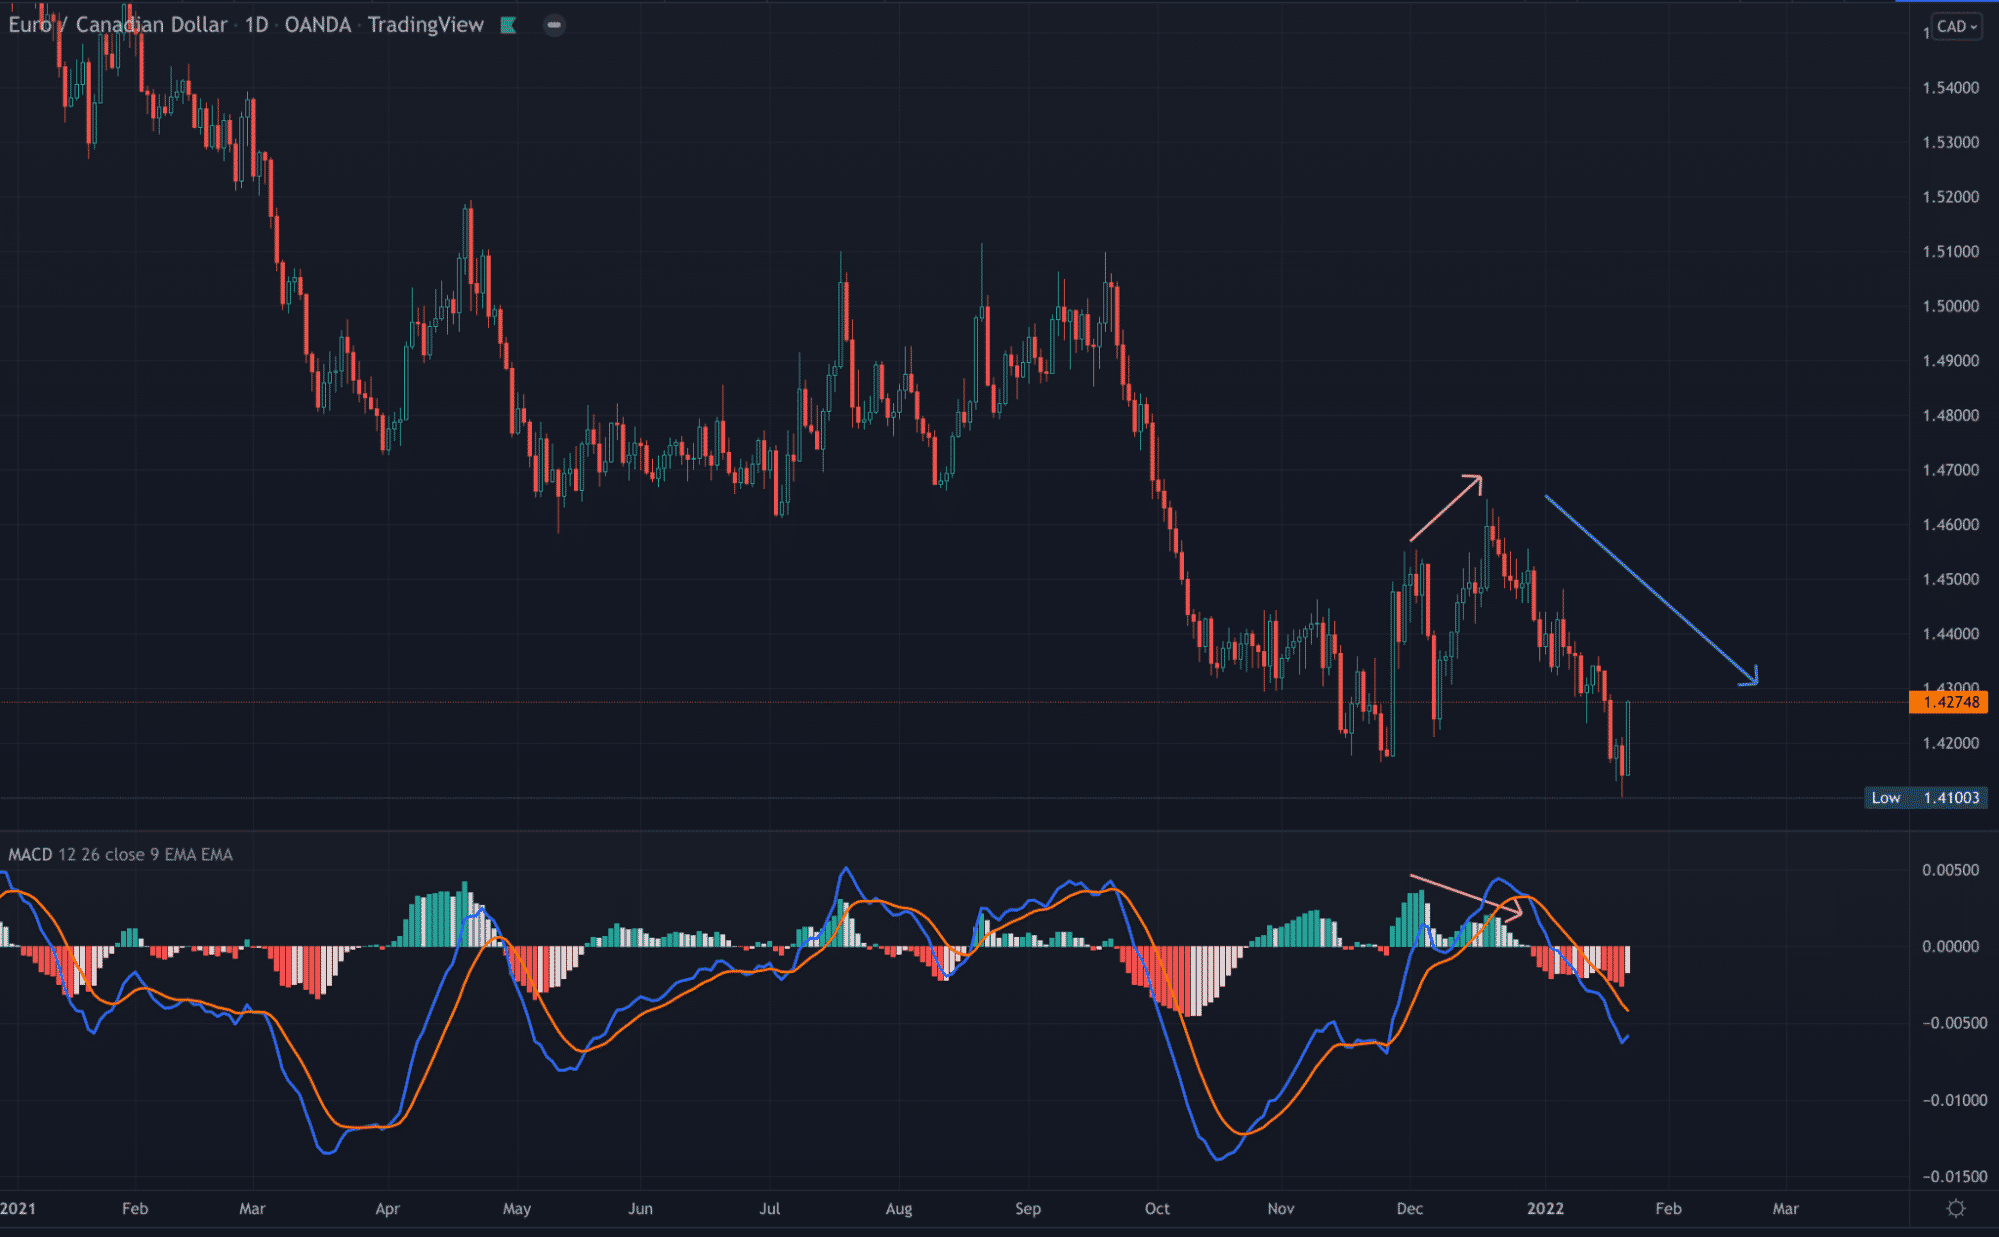
Lastly, MACD can also display divergence (see the example above).
Some tips on using the RSI
Here are some things to consider in this regard:
- One common mistake, particularly committed by newer traders, is selling when the RSI is above 70 or buying when the RSI is below 30.
These peaks suggest that price is likely to continue in a particular direction forcefully in many cases. Overbought and oversold conditions don’t always mean a substantial reversal is on the cards.
After a brief pullback, the trick is to observe whether you find any extremes at price areas where the reading was above 70 or below 30. Momentum loss in one direction could be the catalyst for a new move in the other.
At these points, you may even find divergence opportunities.
- On the point of divergence, the RSI is probably the most reliable in this regard, especially over the MACD. Generally, you will find more of these signals with the former than the latter. The MACD is typically a lot slower with divergences.
Some tips on using the MACD
Here are some things to consider in this regard:
- While the MACD is regarded as trend-following, most traders will implement an individual Moving Average, typically a 50, 100, or 200-day, to identify the actual trend.
Therefore, the MACD is typically used for entry triggers through crossovers. Essentially, it’s rare for a trader to use the MACD alone to identify a trend.
- The MACD is helpful with entering into ‘dips and rips’ within an already established directional movement, meaning it deals less with reversals.
- As previously mentioned, while the indicator does display divergence, it is a lot slower here. Yet, as this doesn’t occur frequently, it could be considered more potent.
Final word: which is better between the RSI and MACD?
Ultimately, no indicator is substantially better than another. It all depends on the trader using them—moreover, certain aspects of price matter more to some and less to others.
For instance, some traders swear by first identifying the trend, while others are more concerned with reversals and momentum changes. Therefore, MACD is a better bet for the former as it provides numerous signals within an established trend through crossovers.
RSI is more suited to those looking for reversals through divergences and scenarios where the market loses steam due to declining momentum.
Yet, as with any indicator, the shortcomings of both are the same: these tools are heavily lagging. Thus, you can expect many false signals using either. Therefore, you have to layer your analysis with more confirmation factors for better predictive success.