In order to benefit from their trades, Forex traders make use of several tools and techniques, one of which includes the moving averages or MAs. Such indicators are typically known for their trend gauging abilities and the detection of resistance and support points. One of the commonly used MAs is the exponential moving average. Let us learn more about this indicator and how you can make use of it to grab great opportunities in trading in this article.
What is an exponential moving average?
Exponential Moving Average or EMA is a common indicator used by Forex traders. The EMA is used to ascertain the entry and exit scenarios in the trade as per price action. It can be put on trading charts. When this indicator is at a low point, you can make a purchase, and when it is at a high point, you can make a short or regular sale.
The EMA is known for its distinct ability to incline towards the latest time spans in trading. It accentuates the latest occurrences in the price movement, which is significant since you need to focus on the latest occurrences in trading rather than what happened in the last month or week. This results in the smoothening of the outcomes that take place due to price alterations.
Calculating the EMA

In order to gauge the EMA, you must add some part of the latest price to a share of the earlier MA value. Below is the formula to assess the EMA.
EMAt = α x the latest price + (1- α) x EMAt-1
Here,
- EMA refers to an exponential moving average.
- t refers to today or the current time.
- α refers to the smoothing factor that falls within 0 and 2.
- EMAt-1 refers to the last time’s or yesterday’s EMA.
This shows that you must figure out the EMA for earlier periods or yesterday in order to identify today’s EMA. Therefore, you must first know the initial value of the EMA for the primary time span that you want to assess.
There is also the value of the smoothing factor, which is mostly chosen as 2 since it puts emphasis on the latest examination. You can also calculate it through this formula, 2 / (N+1), where n is the total days in the EMA. If you increase the smoothing constant, then more new examinations will put stress on the EMA even more.
EMA vs. SMA

One other type of MA besides the EMA is Simple Moving Average or SMA. As its name suggests, it’s a simple way to find out the average. It takes into account all price rates without any differentiation, and the average is the mean.
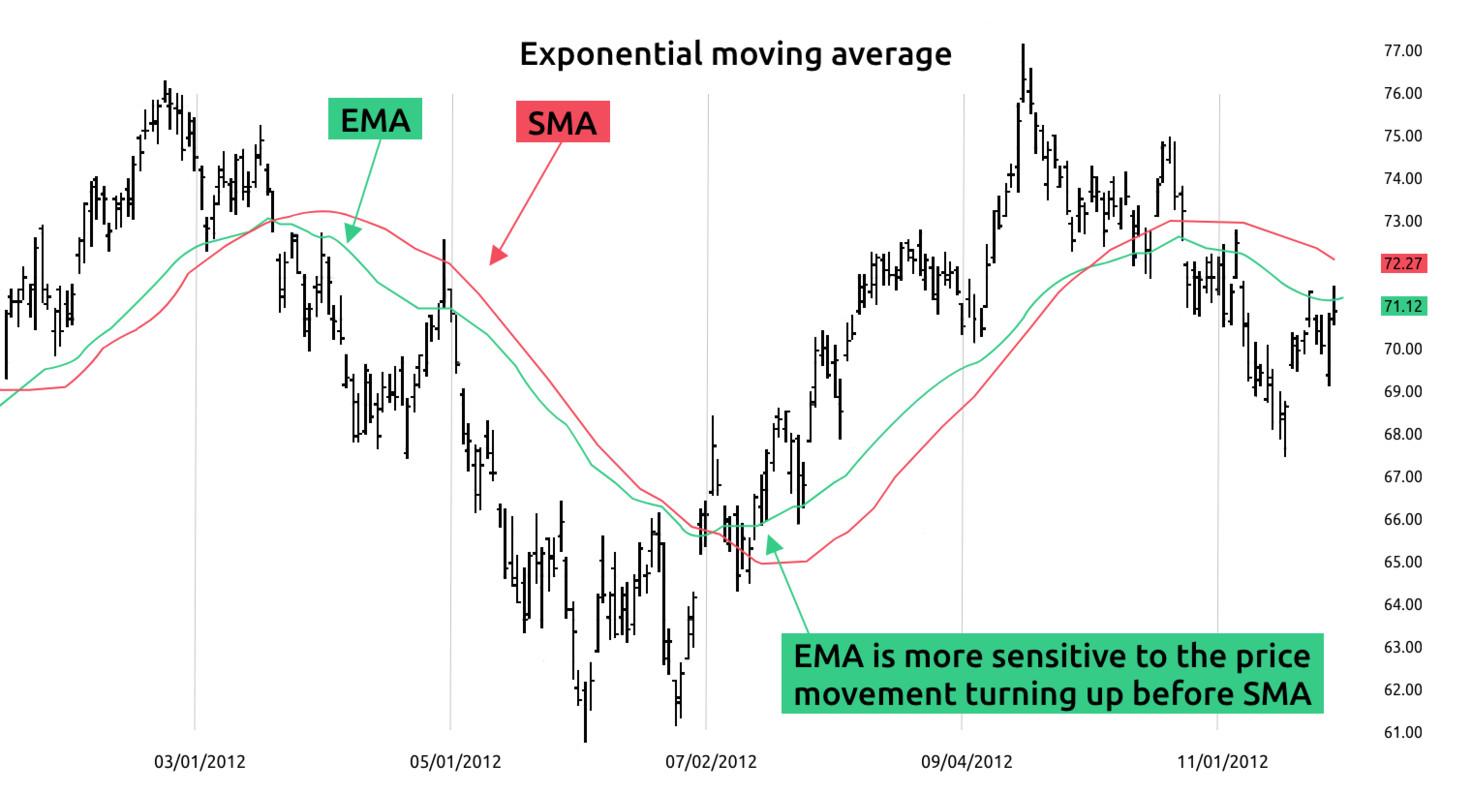
SMAs allow you to know whether a currency pair is trending down, trending up, or ranging. They show you a smooth chart while removing most of the alterations. However, the SMA is relatively slow, which results in delayed buying and selling signals.
When contrasted with the SMA, the EMA determines the new price shift more exactly. It is quick and can better display the latest price movements. Though, the EMA can occasionally display deviations and wrong signals.
How to use the EMA in trading

The EMA is normally employed by day traders who carry out their trades quickly. This MA indicator can be used on its own in your trading technique or mixed with other technical analysis tools. Here, we will discuss how you can use it alone, and in the next section, we will talk about how you can combine it with other tools.
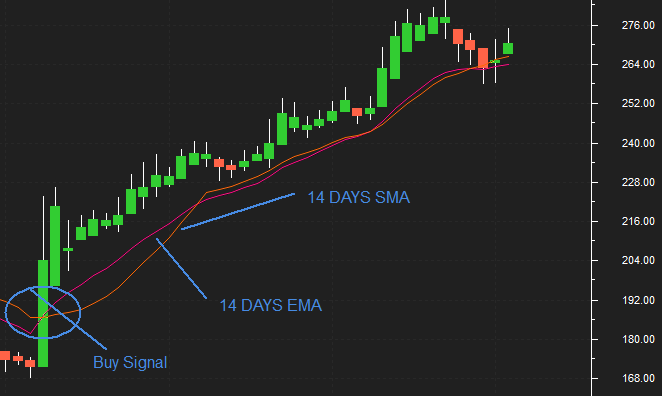
Before you use the EMA independently, you must have a system that can verify the signals that you detect. Plus, you can use two EMAs with varied time periods. Using the EMA is easy as you can use it in the same way as you employ other MAs in your trading techniques. You can spot the path of the trend or a sell or purchase signal with the help of two EMAs with distinct time spans.
Using an EMA with other indicators
As mentioned before, you can combine the EMA with other technical tools in your trading system and analyses. So, if for instance, you have a breakout trading technique, then you can mix the EMA with Bollinger Bands. These will work as trend filters and aid you in ascertaining the trading signals.
Additionally, you can utilize momentum indicators and trendlines with the EMA. Momentum signs include the Moving Average Convergence Divergence or MACD, Average Directional Index or ADX, etc. They can show you a forthcoming deviation in the direction of the market before the occurrence of a MA crossover due to the extreme price movement.
Trendlines can show you if the market has entered a ranging area or is in a trend. With trendlines, you can make different chart patterns, for instance, triangles and channels, which can specify the probable upcoming course of the market.
Drawbacks of the EMA
One of the disadvantages of EMA is that it can lead to whipsaw and provide false signals. This is because it swiftly alters as per the latest variations in the price. However, a lot of traders think that new information is great for showing the latest trend. Moreover, when used alone, it shows you delayed entry and exit positions since it’s a delayed indicator.
The EMA is completely based on the previous data. A lot of economists reckon that markets are efficient and their latest prices show all the existing details. This, in turn, means that if the markets are actually efficient, then the historical info cannot tell us the upcoming course of the market price.
Conclusion
The EMA is a moving average that lays greater significance on the most recent data points and market conditions, thus leveling the price information. It’s a technical tool that can help you identify the buy and sell signs as per the divergences and crossovers from the historical average.
Plus, it can inform you about the entry and exit positions and the trend’s course. Nonetheless, you must know that the EMA has a lagging response. As with other technical indicators, the EMA cannot always be right, though the positive signals can surely provide you with an edge.
