One of the most popular in this regard is triangles, a formation where price moves into a gradually contracting or tight range, converging into something resembling a wedge. Hence, some traders refer to this setup as a rising or falling wedge.
As the market ‘compresses’ further into this shape, traders expect a breakout where the price moves forcefully in a particular direction in mostly bullish or bearish candles with minor retracements.
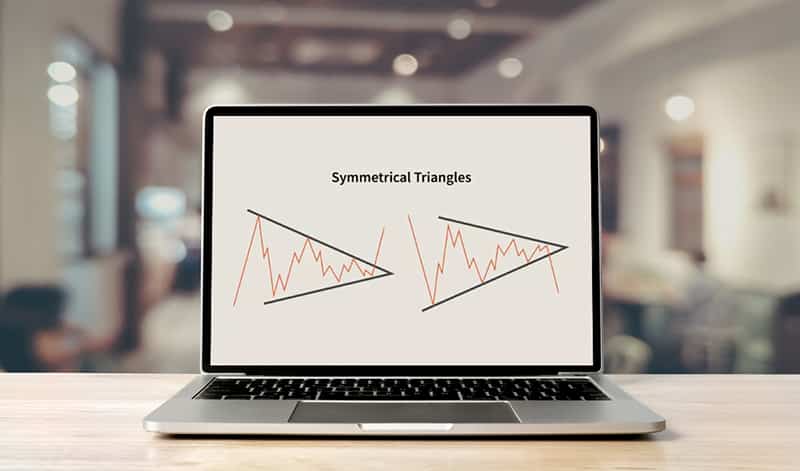
There are three different types of triangles, namely ascending, descending, and symmetrical. This article will focus on the symmetrical triangle breakout, a pattern where the slope of the price’s highs and lows converge towards a center point, resembling an acute triangle or one that’s not perfectly right or left-angled (see image above).
Such a triangle is interesting as it materializes in trending and range-bound markets. Many analysts typically regard the symmetrical triangle breakout as a continuation pattern.
However, you can witness numerous scenarios of this triangle becoming a catalyst to a reversal, especially in range-bound conditions. Therefore, this pattern is an occurrence one can frequently spot across numerous markets and time frames.
This article explores this intriguing breakout triangle method with easy-to-follow identification guidelines.
Identification guidelines
As expected, the symmetrical triangle pattern breakout strategy encompasses a few guidelines trader traders should follow diligently. We’ll break these down into four primary parts with TradingView chart demonstrations.
1. Identifying the market condition
As previously mentioned, you can utilize this triangle as a continuation or reversal pattern. You should establish a bias of where you believe the price will break out towards the tighter it consolidates in the triangle.
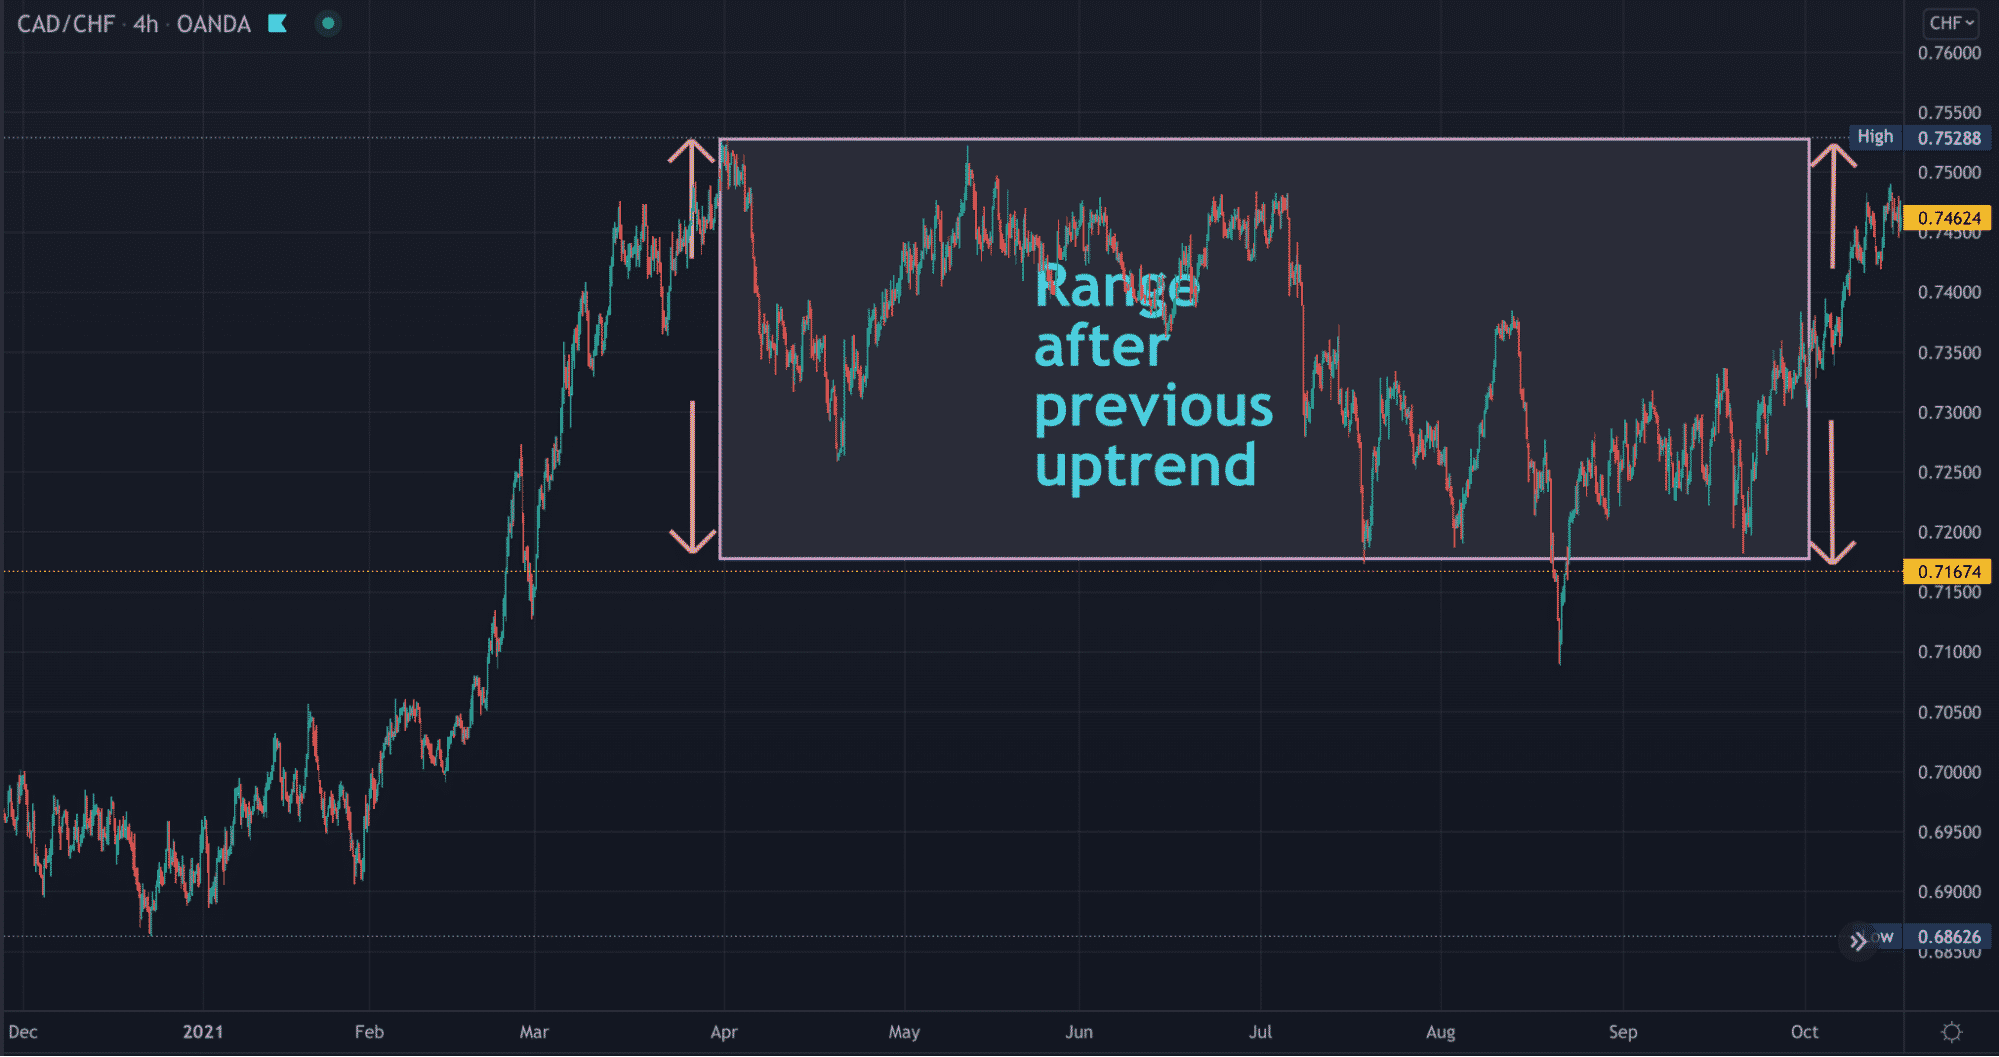
Our example above shows a recent ranging CADCHF market on the 4HR time frame. In this scenario, traders would expect the market to break out back to the other side of the range (in this case, to the downside).
2. Drawing the triangle itself
Any triangle involves the plotting of two converging trend lines. Generally, most experts agree a symmetrical triangle exists when each line touches a series of at least three highs and lows.
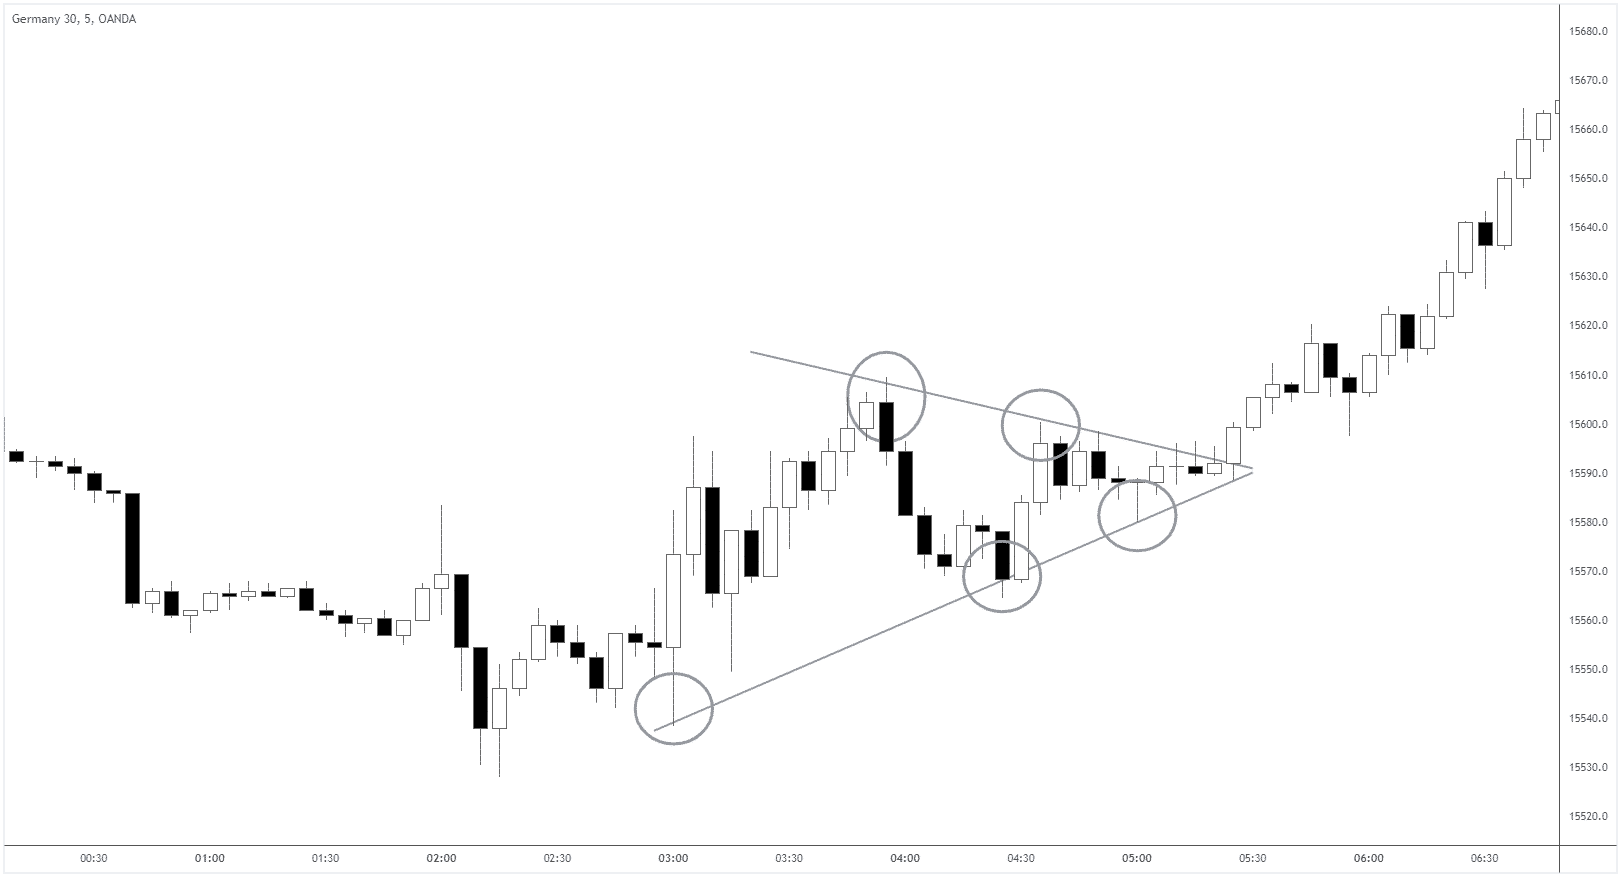
We’ve circled the ‘touch points’ on each trendline in the chart above. One essential tip is not to worry about connecting every high/low perfectly. What’s crucial is having at least three touches on each.
3. Entry trigger and stop loss placement
Gaining the proper entry into a symmetrical triangle breakout pattern is tricky as one needs to avoid a ‘false break.’ The only way to reduce this occurrence is by looking at the price action. Ideally, you want to see a full or mostly full-bodied bullish or bearish candle breaking out of the trendline.
Once this has happened, you should expect a pullback consisting of more candles. At this point, you can use the Fibonacci retracement tool by drawing it from the low/high of the initial impulse to the most recent high/low.
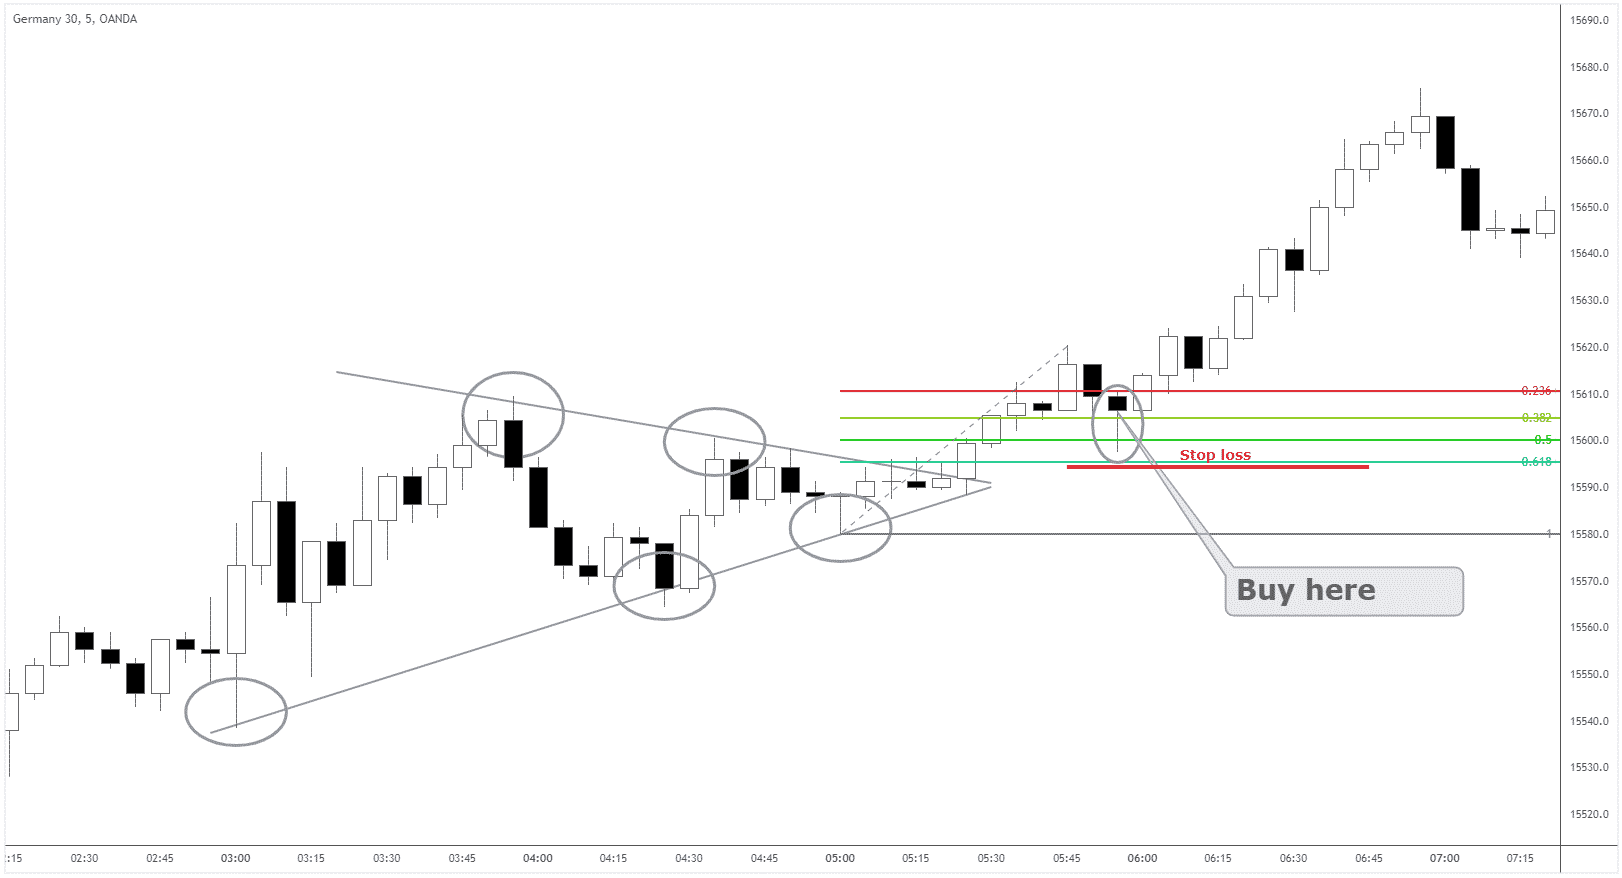
The best level to enter is between the 0.236 and 0.618% retracement, with your stop loss below the high/low by several pips to avoid ‘stop hunting.’ We’ve outlined all these factors in the chart above.
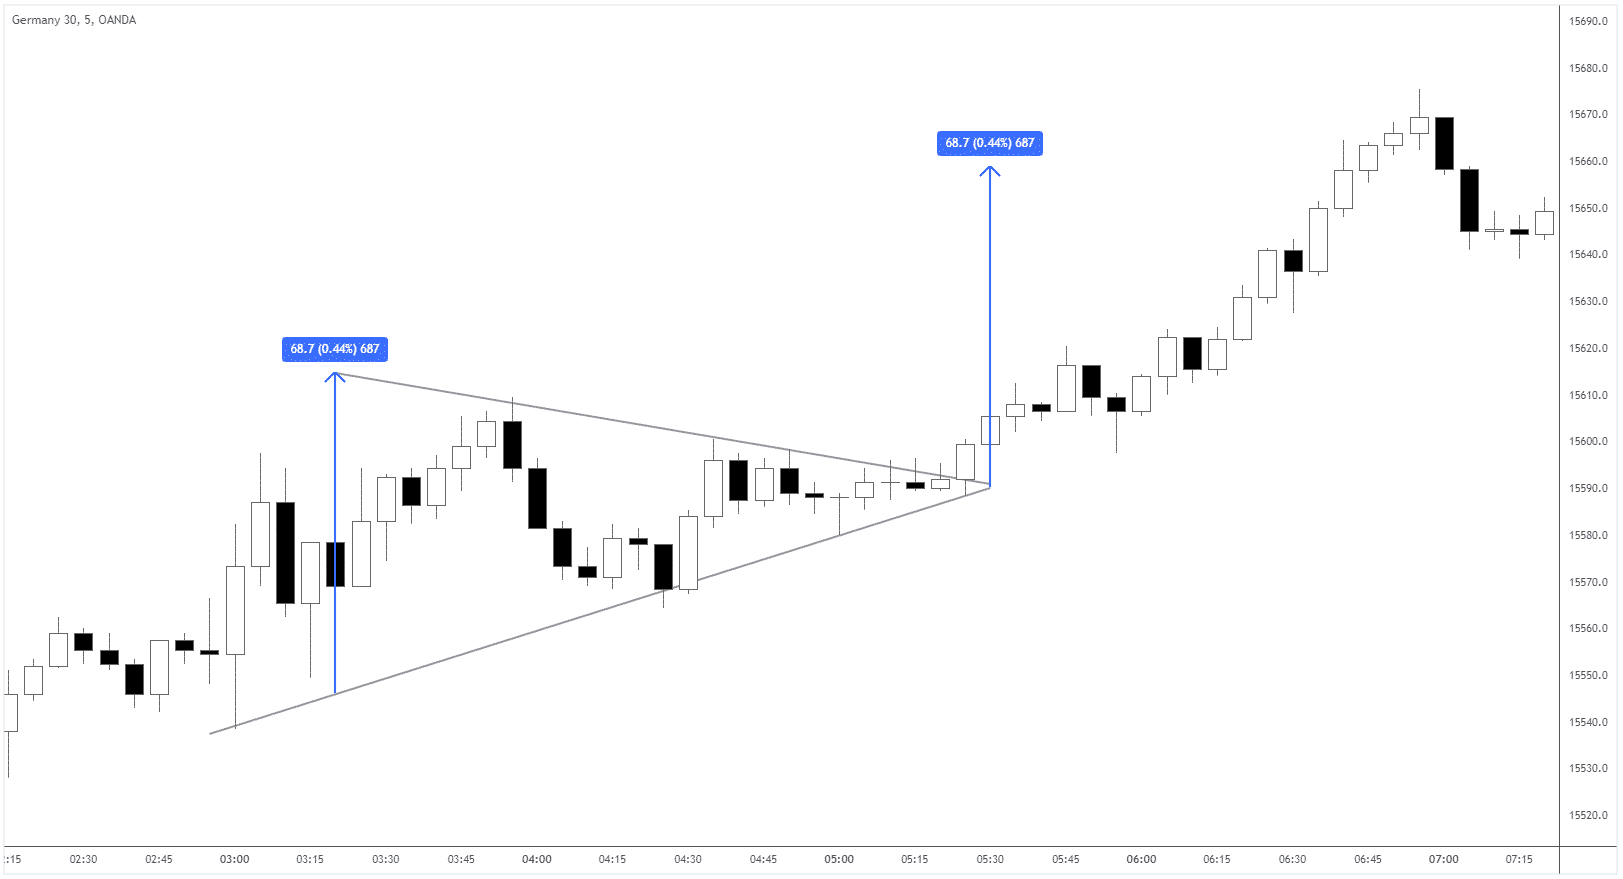
4. Price target
The most common target for this pattern is roughly the vertical height of the triangle. The chart below shows that price did indeed travel this distance precisely. Of course, not all instances will produce this outcome.
Therefore, you’ll need to be flexible in your take-profiting approach by moving your stop to a logical level once the price has moved in your favor to a considerable extent.
Conclusion
The symmetrical triangle is a fascinating look into market consolidation. When this pattern forms, no group is winning the fight between the bulls and bears. As price keeps ‘squeezing,’ one party will eventually be victorious, causing an often violent breakout.
Traders like breakouts because of their fast-moving nature, meaning one can realize more significant profits in a shorter period. Yet, traders should know the best way of avoiding false breakouts, which are prevalent with these strategies.
Therefore, you should practice this strategy for a long time with clearly defined rules to limit losses.