The ascending broadening wedge (ABW) is a horn-like consolidation of two price trend lines sloping upward. The pattern begins from an uptrend of prices, and it continues to go upwards before initiating a bearish reversal. The prices will broaden due to reduced volatility before the pullback shifts to a downtrend. The ABW is expected in a bullish market. A downward breakout ends after the upward slope hits a turning point. The prices drop drastically after prices break through the bottom price trendline. The two non-parallel trendlines (on the top and bottom of the wedge) form an alternating price action. The price within the trendlines rises and falls as the wedge slopes upwards.
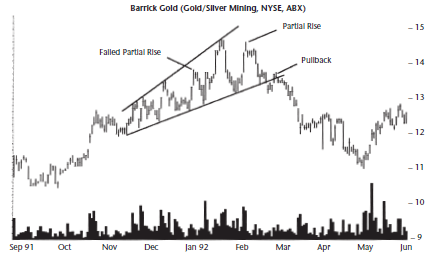
Figure 1: An ascending broadening wedge (ABW) with alternating price action
The prices within the trendlines broaden as the wedge moves upwards. They alternate between partial and failed rise within the nonparallel trendlines. The pullback takes place just before the price hits $14 in March.
Price oscillation in a practical example
The partial rising/falling price moves should touch the trendlines if a bullish continuation is maintained. Failure of the price moves to touch the trendlines shows a trend-change/ reversal is expected (see figure 1 after the pullback).
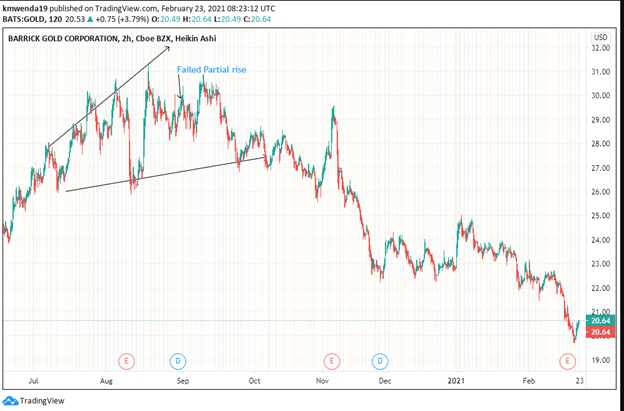
Figure 2: Ascending broadening wedge of Barrick Gold Stock
The two rising price moves (partial and failed partial rise) do not touch the top trend lines in the wedge’s upper line. The partial rise follows the failed partial rise. This move indicates that the price will move upward after the breakout for a short while before initiating the downtrend as a reversal play.
The broadening wedge as it ascends shows that the rise of the price trend may not exceed the partial rise. If we consider the difference between the failed and the partial rise motions, the highest stock price or the resistance is expected at $30.19 (see figure 3). A reversal may not always be the natural trend. We may see a continuation of the bullish trend after a while, although the price in many cases follows the wedge motion. If prices assume a bullish run, as we see in figure 3 from November to December 2020, the rise may not reach the highest point attained by the partial rise.
The wedge movement for Barrick Gold is explained by observing the price trend. On June 5, 2020, the stock’s price stood at $22.15 (the support). There was an increase in buying activity, with investors unwilling to sell the stock. The stock rose until it formed the wedge between $26.13 and $27.88. The upper section of the wedge rose until prices hit $31.31. Here, it became too pricey as the wedge finished formation.
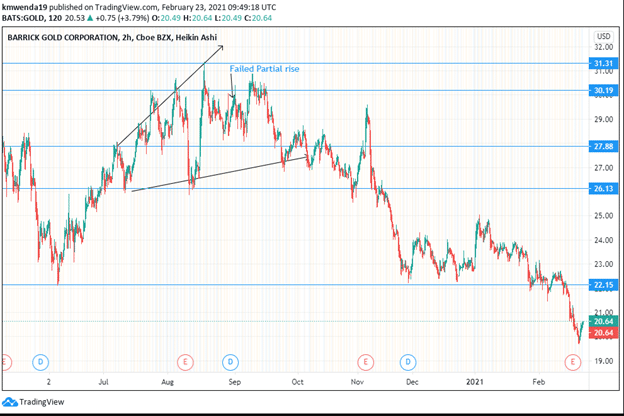
Figure 3: Partial rise movement
The rise in prices resulted from impulsive buying of the stock from June through to mid-July 2020. Traders stopped buying for a moment, and the stock slid down to $26.13. Later on, other investors’ continued purchases drove the prices higher while maintaining volatility due to the company’s fundamental inclinations. However, the decline in prices after the wedge was formed did not go past the wedge’s beginning (at $26.13).
Traders have been sensing an overbought situation of the stock, meaning increased volatility. The selling of the shares into 2021 has exceeded purchases. This situation has pushed prices below the breakout trendline. Barrick Gold hit a new high at $29.52 on November 5, 2020, after opening the wedge at $26.13 (August 11, 2020). High selling pressure from traders at this point exceeded purchases at the time. Barrick’s shares tumbled and have since hit a negative trajectory going below $20 in February 2021. The lower trendline does not ascend as steadily as the upper part. This situation shows that the price move may not be strong upwards. Investors should not put a high resistance point.
Identifying an ascending broadening wedge
- The ABW looks like a horn or a megaphone. It is tilted upwards as the two price actions denote an up-slope.
- Neither trendline is horizontal, with the upper line steeper as compared to the lower one.
- Each side of the trendline should have at least three touches (or near touches). Such an occurrence assures the trader of the accuracy of the pattern in interpreting the price move.
- The volume is irregular due to high volatility that rises above the pattern’s length.
- The ABW has a downward breakout as the price action moves downwards after completing the wedge formation.
Trading recommendations
Since the ABW represents a bearish reversal, the trader will want to check the downward breakout. To establish the minimum price move, consider the lowest price during the formation of the wedge. In case you want to target the upward breakout, get the height of the ABW, then add it to the breakout price.
Before shorting the stock (as the ABW signals a bearish reversal), wait for the downward breakout to reveal itself. For example, figure 3 shows a false breakout at 27.00. The stock rises further to $27.88 and $30.19. The trader that waits for the downward breakout to establish itself between these two points will have an easier time getting the right trade.
A downward breakout mostly follows a partial rise. The trader will watch the partial rise and sell short afterward. In figure 3, the partial rise is at $30.19.
Conclusion
An ascending broadening wedge (ABW) is a megaphone-like consolidation of two trend lines that are sloping upwards. The formation of the wedge begins with an uptrend of the stock’s price. However, the wedge signals a bearish reversal in most cases as opposed to a bullish continuation. The wedge has two oscillating portions known as the failed and partial rise of the price motions. Short-selling of the stock using this pattern should wait until the downward breakout validity is confirmed.