
The concept of a drawdown is one rarely spoken of in-depth. It is a multi-layered topic where each individual factor can have a profound impact on a trader’s performance.
This article will best attempt to analyze this idea deeply in forex and how traders should approach it based on random distribution, the risk percentage, trading style, recovery rate, and risk to reward ratio.
What is a drawdown?
A drawdown refers to the reduction of a trader’s equity from a high to a low point as a percentage. For example, if someone lost $100 from a $10,000 account, that is a 10% drawdown.
Most analytics platforms such as Myfxbook, FX Blue, and PsyQuation automatically calculate this figure based on the gains and losses. From an investment perspective, the drawdown percentage is one of the most crucial performance metrics in assessing how good a trader is risk-wise.
Is there an acceptable drawdown percentage?
Perhaps this section is the most vital as it attempts to answer the thorny question of whether there is an acceptable drawdown figure. Unfortunately, while people throw around numbers like 5%, 10%, or 15%, this shouldn’t be universally accepted because there are numerous considerations at hand.
Random distribution
Any tradable market, especially one as dynamic as forex, comes with a random distribution of trade probabilities or outcomes. A risk-centric trader should internalize this fact.
Ultimately, as a trader, you should imagine a jar of marbles where each marble either represents a loss or win. When we shake this jar blindfolded, we will never conclusively know which marble will come out.
In trading, the analogy is the same; as every trade outcome is totally random and completely independent from the previous one, we will never know which trade will win or lose. This realization is crucial in appreciating the inevitability of a drawdown.
Trading style and risk to reward (R:R) ratios
High-frequency or intraday traders should generally have lower drawdown limits. By trading more regularly, there is more exposure.
We should remember, as market conditions never remain constant, a drawdown typically occurs during such times, and this is a natural part of any trading strategy. With the rise in trading frequency, a trader is much more exposed to sometimes unfavorable market conditions.
However, it doesn’t necessarily mean we always definitively know which condition is favorable to us as we should generally treat every opportunity with the same probability.
Intraday traders typically have lower R:R ratios as they target small targets. The win rate over time increases as the price takes a shorter period to reach the desired profit. In contrast, long-term traders generally have lower win rates.
As they have larger targets, price does not always get to this point (or takes longer) but may reach faster to their stop loss. However, because of the greater reward, they can recover from a notable string of losses.
Using both of these scenarios, let’s look at the examples below.
Example A
Let’s imagine a day trader with a $1000 balance. If they took five trades risking 2% of their account ($20) for each position, and let’s assume they lost all consecutively, that is 10% down ($200). Now let’s also imagine their R:R is 1:2, meaning that for every trade, they aim to win $40.
We should know with a 1:2 R:R ratio, it could take them far more than five trades to return to ‘breakeven.’ There is no guarantee (random distribution) they will now have five winning trades that would equate to $200.
Assuming they have back-tested their strategy for at least one year and simulated their results using the number of executed positions if this data reflected a 10-trade losing streak, it means the drawdown could go as high as 20% (2% X 10).
So, even if the strategy is profitable, the recovery would take more time. Therefore, the trader may need to reduce their risk per position and/or increase their R:R. A smaller R:R generally makes it difficult or takes longer to move out of a substantial losing streak unless the risk is lower per position.
Example B
Using the same account size, let’s imagine a swing trader also risking 2% but trading less. Let’s assume they took one position per week with an R:R ratio of 1:10. If their worst losing streak was also ten trades ($200 loss, we can observe one position netting ten times their risk would speedily return them to their previous point ($20 X 10 equals $200).
Drawdown table
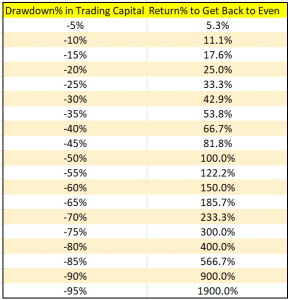
The table above is a typical representation of different drawdown percentages and outlines the recovery against each. Could we ‘draw a line in the sand’ as to what could be a safe drawdown figure?
Ultimately, losing is more psychological than anything else. Theoretically, it is possible to recover from a 40% drawdown, but this is easier said than done, and it’s not a place where anyone wants to be.
Recovery rates
For example, a 40% reduction requires a recovery rate of 66.7% (as in the above table). Netting this figure in one position can be extremely difficult for most, if not impossible. Even if a trader, on average, does net this percentage for their wins, psychologically, 40% is still a vast reduction in trading capital.
At this point, one is likely to become emotional and make mistakes, meaning the recovery may never occur or would take much longer than desired. Knowing the average gain one receives from their winning positions is crucial for determining an acceptable drawdown according to the worst losing streak.
For example, if a trader’s winning positions net them, on average, 5%, they may think about staying between the 5% drawdown mark as it enables a quicker recovery (5.3%). A successful trader needs to keep within a level that allows a speedy recovery from a string of losses.
However, as mentioned, there is a psychological barrier where we cannot afford to risk a lot per position no matter how experienced or confident we are. In contrast, based on the R:R, we should also know the average gain for every win.
So, in answering the question of what is an acceptable percentage, most would agree anywhere up to 20% is on the safe side. Though considering that each of the mentioned factors will vary widely for everyone, some traders may go slightly below or above.
Conclusion
We hope this article has provided deep enough information about drawdowns as it’s an integral concept. To recap, these are the main takeaways:
- A drawdown is inevitable for any trader.
- Random distribution means we never know which trade will lose and win.
- Each trade outcome is entirely independent of the previous one.
- With the above information in mind, based on the parameters of the back-testing result mentioned, traders should know their worst losing streak.
- The higher the R:R, the easier the recovery, though this doesn’t mean bigger exposure is tolerable. A lower R:R does work, provided the risk is lower.
- While there is no universally acceptable drawdown percentage, around 20% is on the safe side, though this can be slightly higher or lower for some.