
The crypto markets, as with any financial instrument, are incredibly chaotic. However, any experienced technical analyst will tell you that price action isn’t necessarily random.
Amidst the chaos, traders can exploit repeatable patterns. Along with charting skills, the main tool used here is indicators. These tools act as a map guiding one in the maze of uncertainty in cryptocurrencies.
Technical analysis of any asset is based on the principles of Charles Dow, which refer to three concepts: everything you need to know about a market is already priced in; price moves in trends; history does repeat itself.
Indicators, which are simply pre-programmed mathematical calculations, have made it simpler to present these ideas for traders to take advantage of the daily-occurring moves in the markets and, of course, make profits.
So, let’s explore the best five tools in this regard for crypto trading.
1. Moving Averages
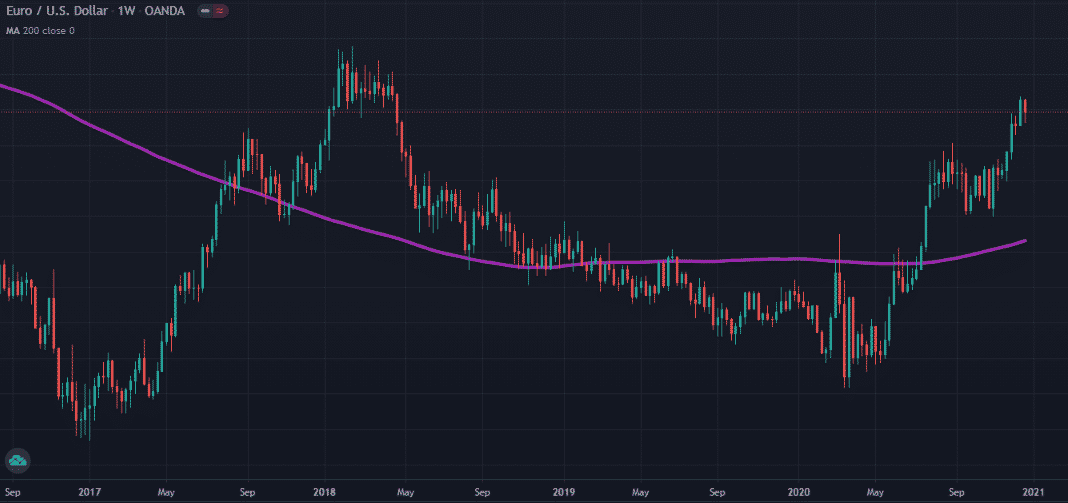
Most popular indicators are intrinsically based on some Moving Average (MA), meaning this tool is the cornerstone of all technical analysis. An MA is nothing more than a constantly advancing line showing you the average price over a prescribed number of days.
Moving Averages are the bread-and-butter of identifying trends. When the price is below the MA, it’s a bearish signal; conversely, it’s a bullish signal when the market is above the MA.
As with virtually all indicators, you can adjust the period with MAs. However, the most commonly utilized are the 5, 10, 20 (for short-term trends), 50, 100, and 200 (for long-term trends).
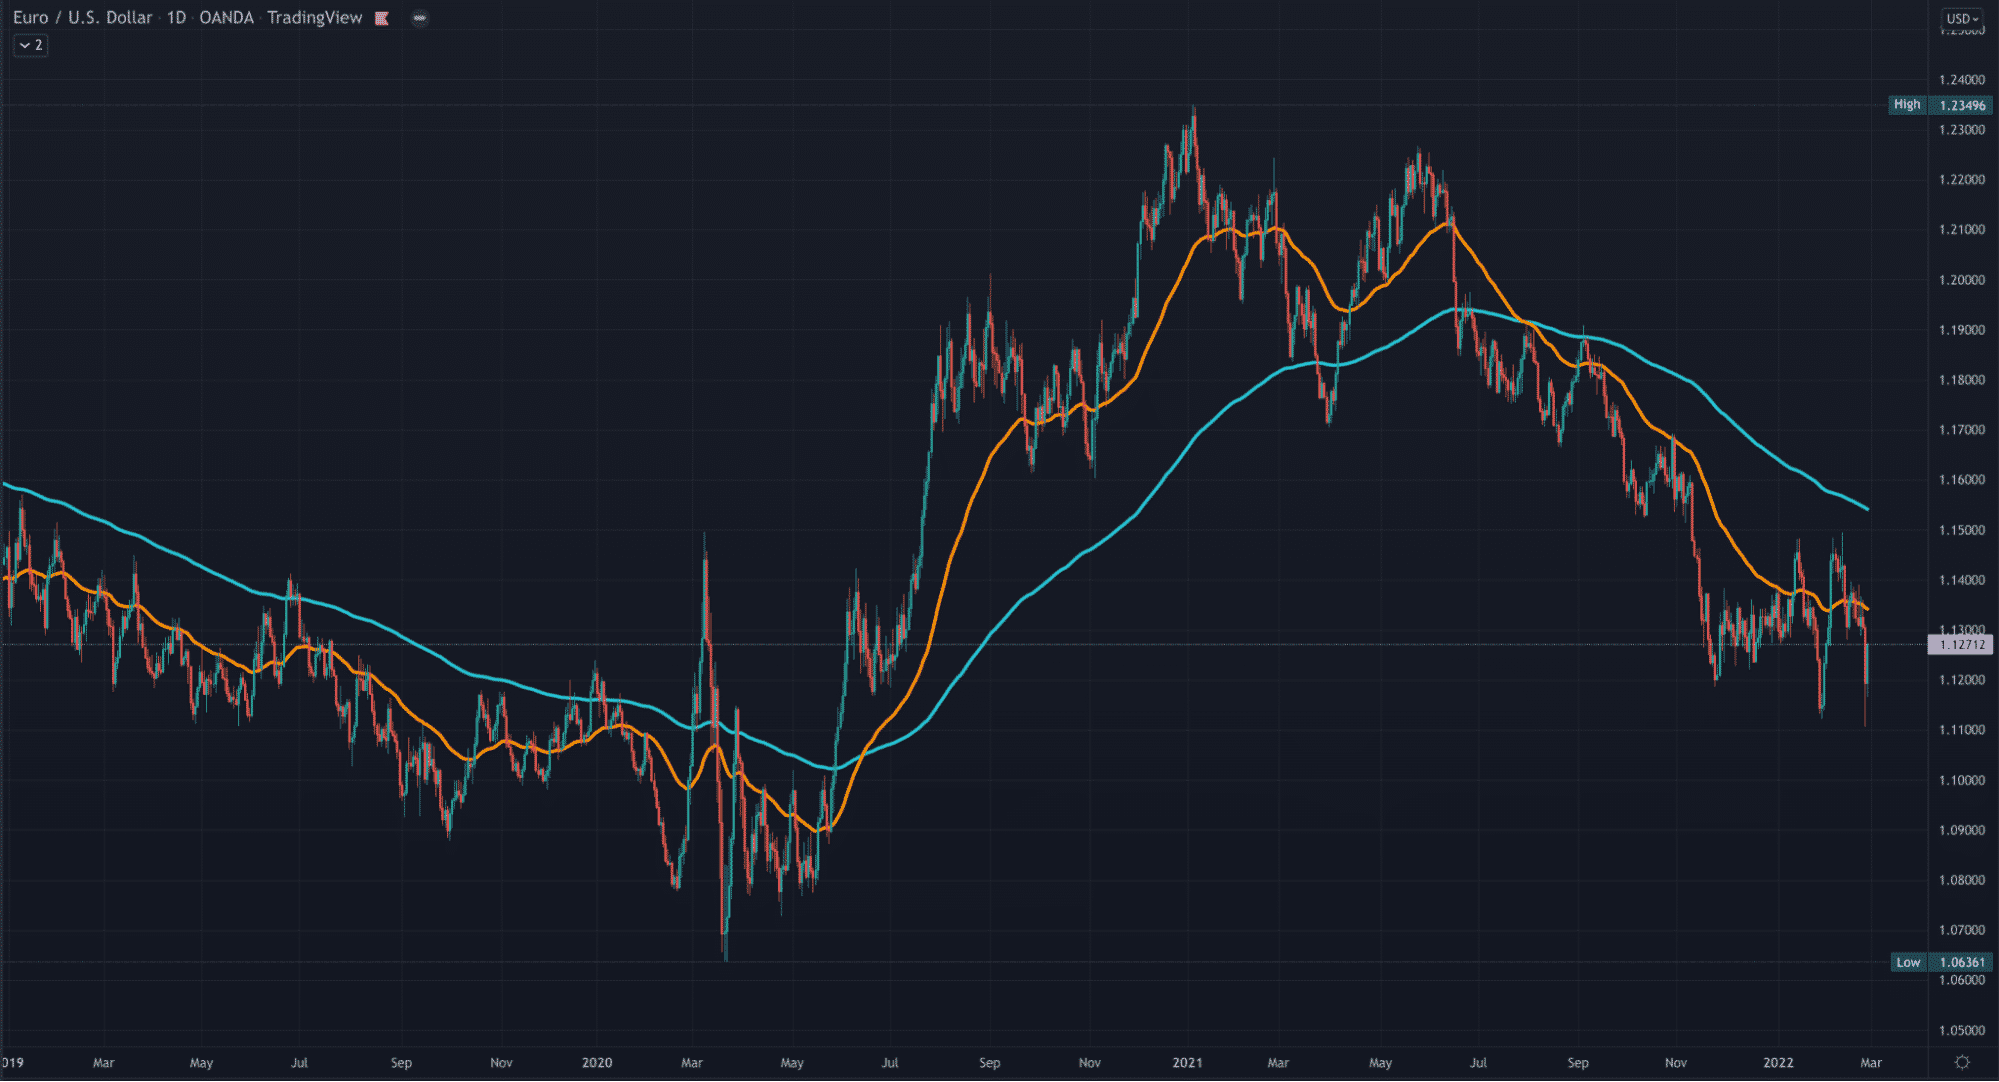
The crossover is another prevalent technique, which uses two MAs, one with a higher period and another with a lower period. Traders wait for a cross between the two as entry triggers an existing or new trend.
2. Relative Strength Index (RSI)
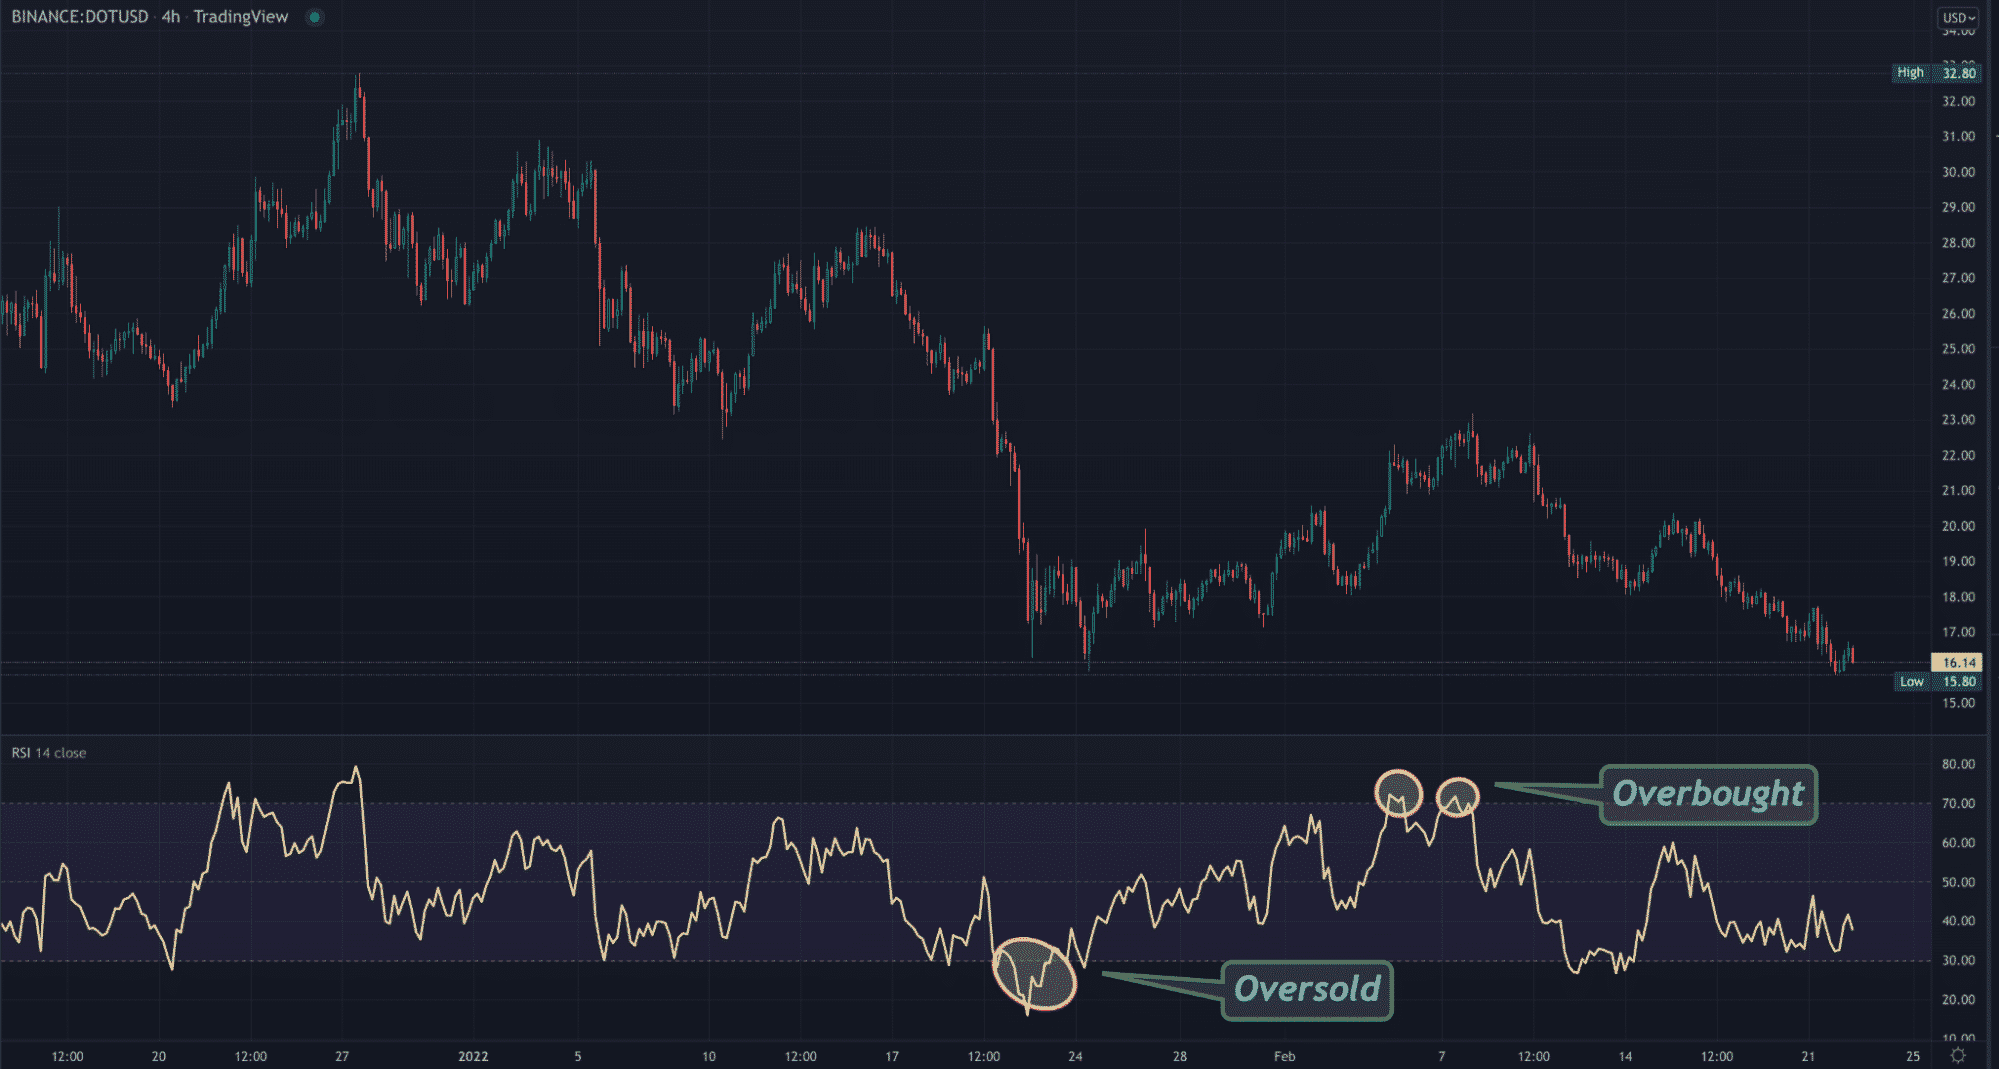
The Relative Strength Index was created by J. Welles Wilder in 1978. It’s used for gauging momentum and is also a staple in crypto technical analysis.
It is intended to chart varying levels of momentum across a past number of days, typically using a 14-day Moving Average. This MA is represented on a line graph fluctuating between 0 and 100 extremes.
Readings above 70 show the market as overbought, while those below 30 represent the market as oversold. This function is one of the RSI’s primary purposes. In overbought conditions, momentum on the upside is at its peak.
There is an expectation that the price will eventually retrace to the downside, but it continues in the same direction in many cases. The opposite is true when there are oversold conditions.
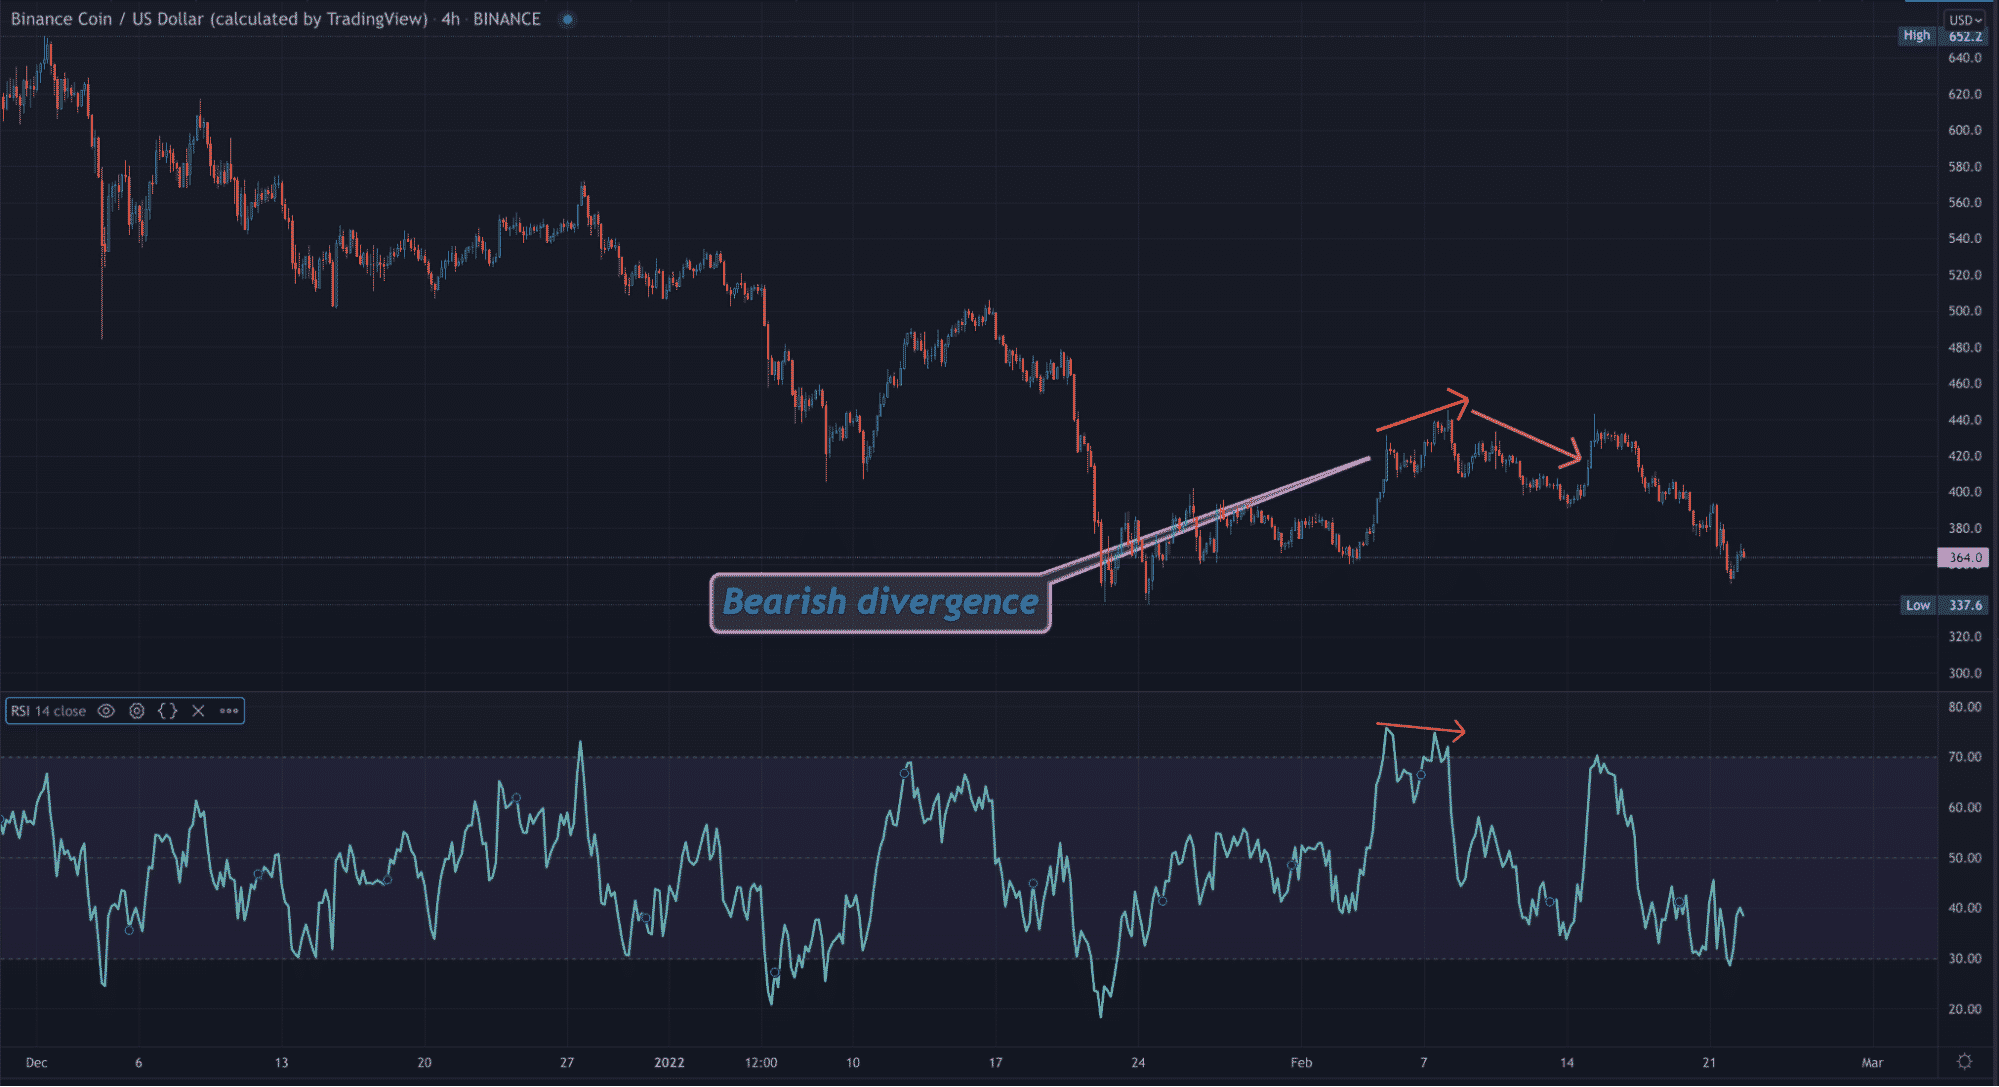
Another classic feature of the RSI is a divergence which is typically an early sign of a reversal (see the example above).
3. Moving Average Convergence Divergence (MACD)
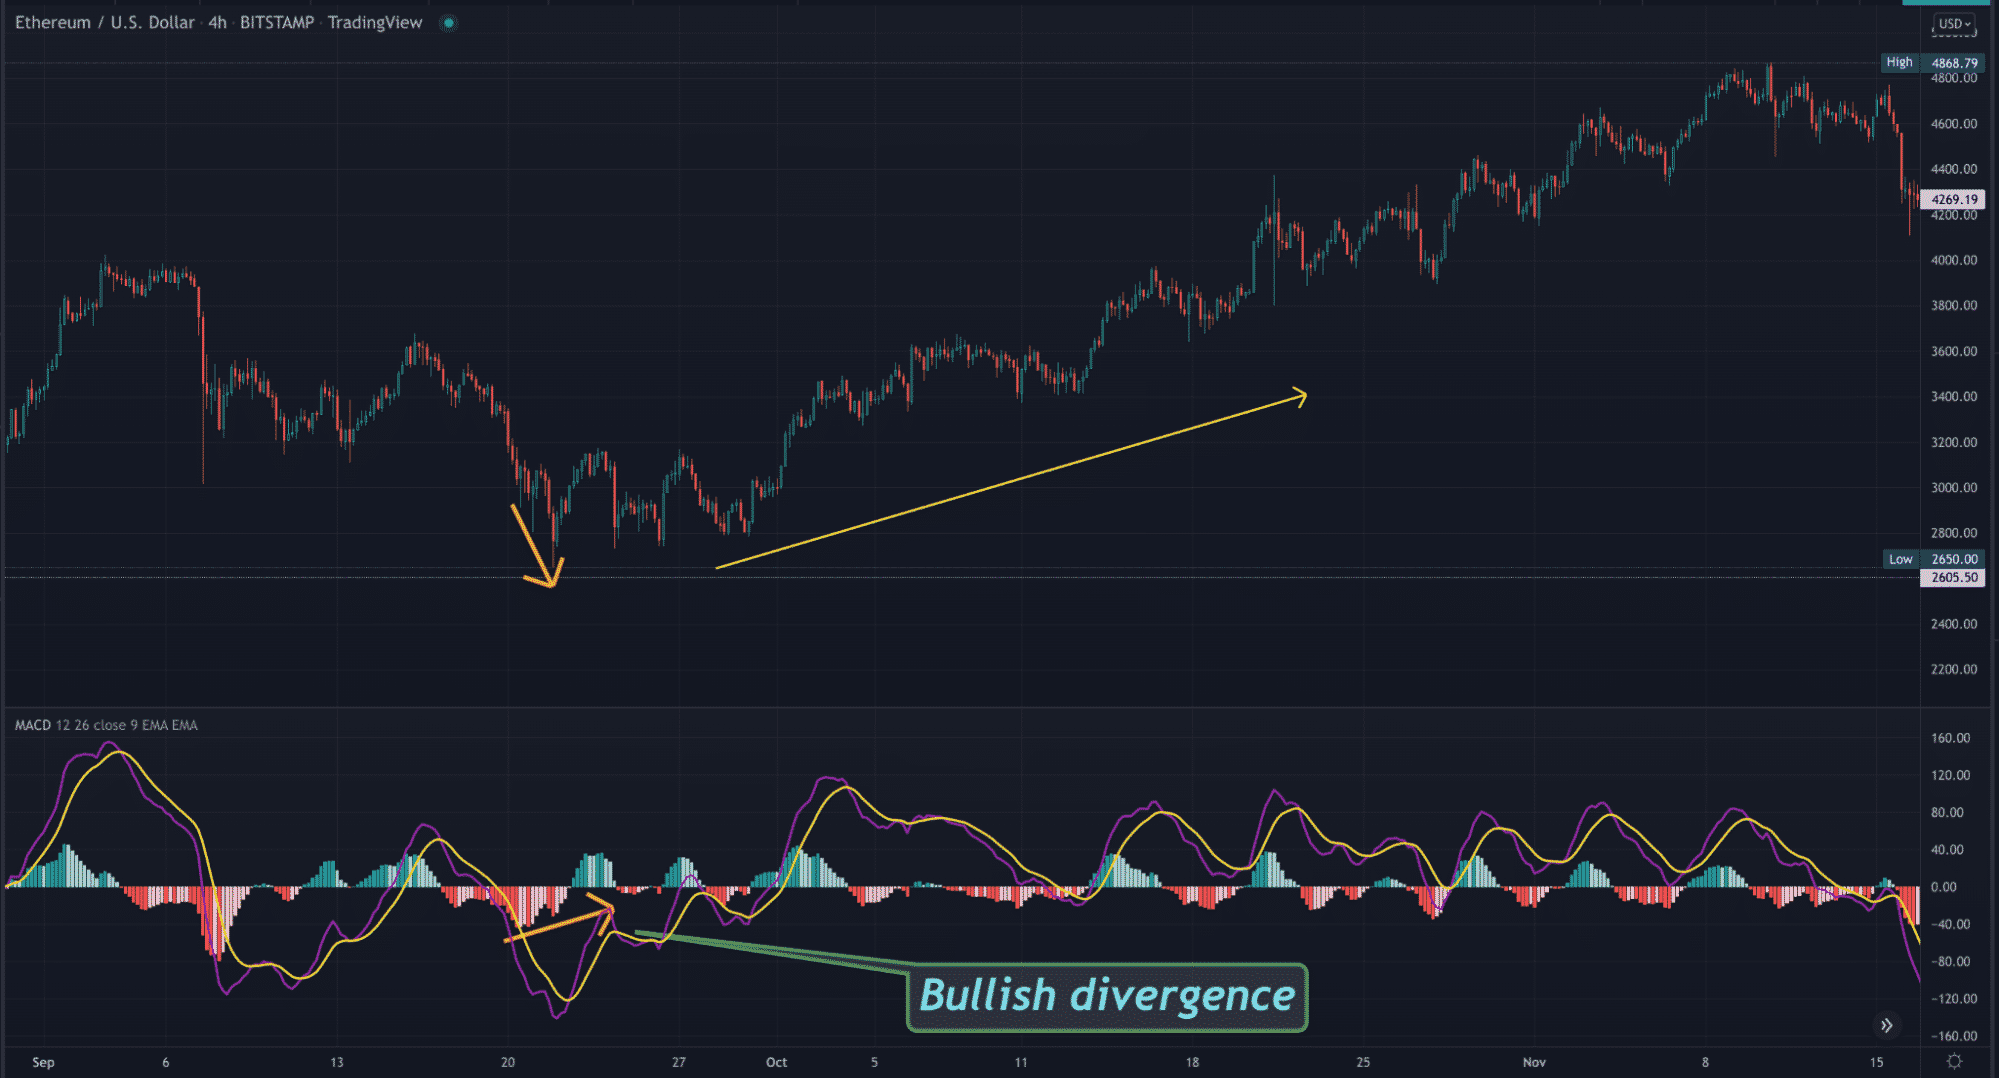
The MACD takes the best of both worlds in trend and momentum following and combines it into one tool. Created by Gerald Appel in 1979, the MACD represents the relationship between two exponential MAs.
By default, the periods here are 26 and 12, referred to as the MACD line. The other element of the MACD is the signal line, which is usually a 9-day EMA.
The histogram peaks simply mimic the behavior of both the MACD and the signal line to show momentum. When the peaks are above the zero mark, the momentum is bullish; the momentum is bearish below the zero mark.
The second classic feature of the MACD is the crossover. When the MACD line (in purple) goes above or below the signal line (in yellow), it’s an early sign of a trend change.
Lastly, like the RSI, the MACD can also display divergence through the histograms (as shown on the chart above).
4. Average True Range (ATR)
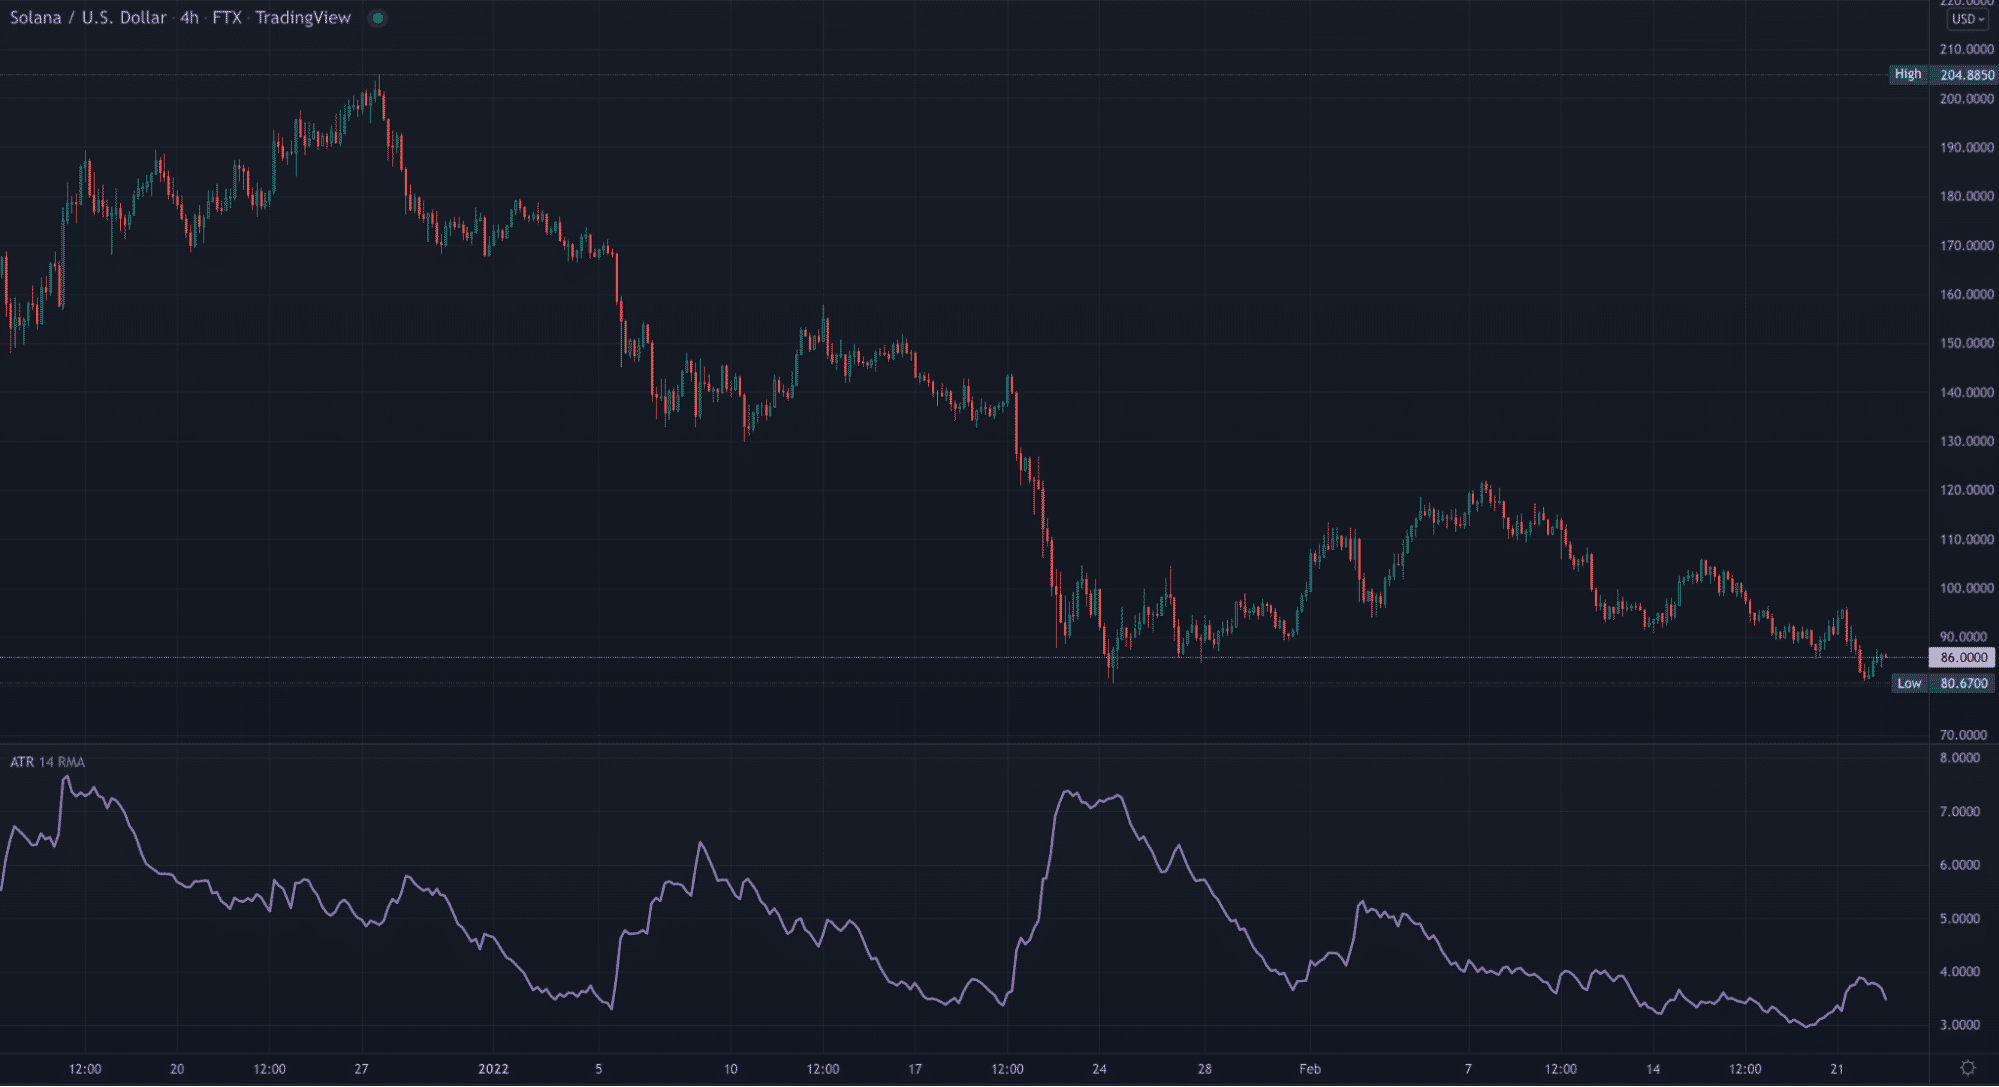
The ATR, also created by J. Welles Wilder (and released in the same 1978 book along with the RSI), is unique in that it’s not primarily utilized for generating trading signals.
Using a unique formula consisting of absolute values for current highs and lows, it shows average volatility over a past number of days (usually 14). This information is particularly beneficial for appropriately setting your stop loss and profit distances.
For instance, if the ATR showed a reading of 1000 pips on the 4HR time frame of Bitcoin, this is how much, on average, BTC will move within four hours. Therefore, it would be wiser to ensure your stop is beyond this point.
The ATR can guide you similarly with take-profit levels where you don’t set these too far above the ATR of a particular time frame. An unorthodox technique used with the ATR is identifying support and resistance at certain areas by comparing the range of a particular candle against the present ATR reading.
5. Bollinger Bands
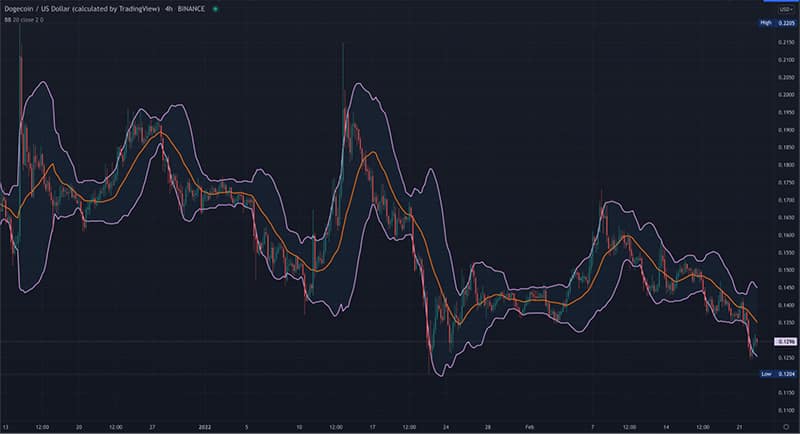
Bollinger Bands, named after the American author and technical analyst John Bollinger, are another fan favorite among crypto traders. This tool consists of two lines which are standard deviations away from a 20-day simple MA.
BBs are primarily regarded as a volatility gauge. Traders observe the contraction and expansion to determine how volatile a market is. When there’s more volatility than usual, the bands expand, indicating a busy and often erratic period.
Conversely, when the bands ‘squeeze,’ it suggests a less volatile and quieter market. This can sometimes be interpreted as a range when the bands appear ‘flat.’
Bollinger Bands also present overbought and oversold signals where traders observe price moving out of the bands. Lastly, as this tool uses a Moving Average, you can identify the trend by simply seeing whether the market is above or below the MA.
Curtain thoughts
You should always remember that other useful indicators not based on technical analysis also exist for crypto trading, most notably the Fear & Greed Index that measures sentiment in cryptocurrencies. Therefore, never limit yourself to strictly charting tools.
Technical analysis has its flaws. Thus, any competent trader will use other factors, such as those based on fundamentals and sentiment, before deciding to buy or sell a crypto asset.