The COVID-19 pandemic has impacted all in one way or another. On a larger scale, all economies around the world have been weakened. GDP in some countries even shrank, as did the United States in 2020 by 3.5%. Negative GDP resulted from firms having to close down and workers not being able to go to work. Some firms had to file for bankruptcy while 18 million Americans were unemployed by the middle of 2020.
In 2021, many countries have reopened up with reassured safety by vaccinations. As a result, economies are starting to rebound. People are earning back their jobs, and firms are producing more efficiently.
But the catch? Inflation.
The rate of inflation has been the highest it has been since the recovery of the financial crisis in 2008. Should we be worried? Will the rate of inflation continue to rise, or will we be able to control it?
Let’s start by diving into the data.
What the data tells us
‘Official’ Metrics
All official economic measures of inflation suggest that we are in an inflationary period. The CPI is the most popular index for measuring inflation. At 5.4%, this is the highest it has been since the economic recovery in 2008 and much higher than the ‘healthy’ 2-3% recommended by most economists.
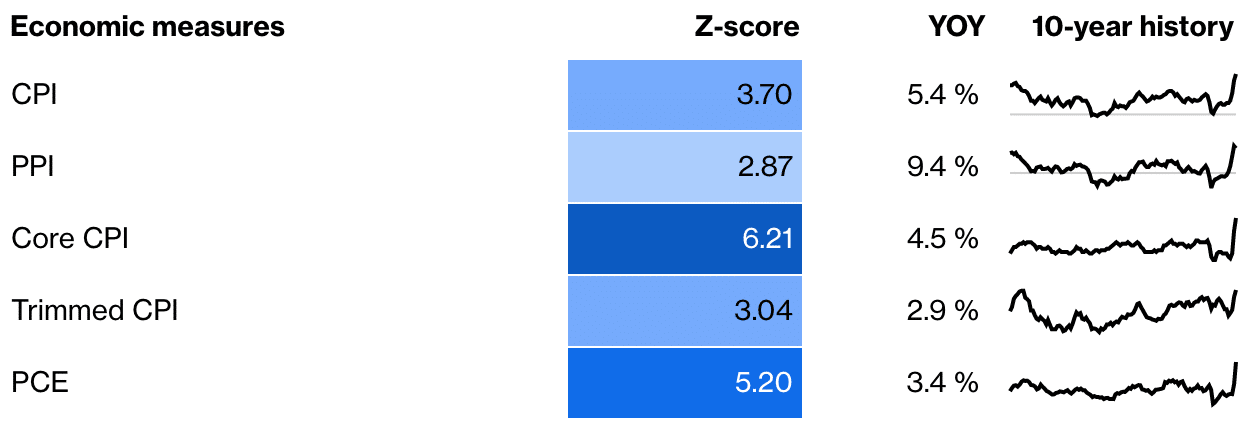
Official Measures of Inflation in the US in 2021
Another measure that is useful is the trimmed CPI. This metric ‘trimmed’ out the goods and services that have extreme movements in price. Therefore, it is relatively reliable as outliers are eliminated. Even then, it is at 2.9%, which is definitely towards the higher end.
Governments and federal banks prefer the Personal Consumption Expenditures (PCE) index. This does not include food or energy prices. At 3.4%, it is the highest it has been in 30 years.
Sector-based Inflation
These data demonstrate the CPI with regards to different sectors. We can see that most sectors have returned to normalcy, most of them at a sustainable rate. The biggest concern lies in the ‘Shelter CPI’ as it is the most significant component of the CPI and has the highest rate of inflation, excluding car rental.
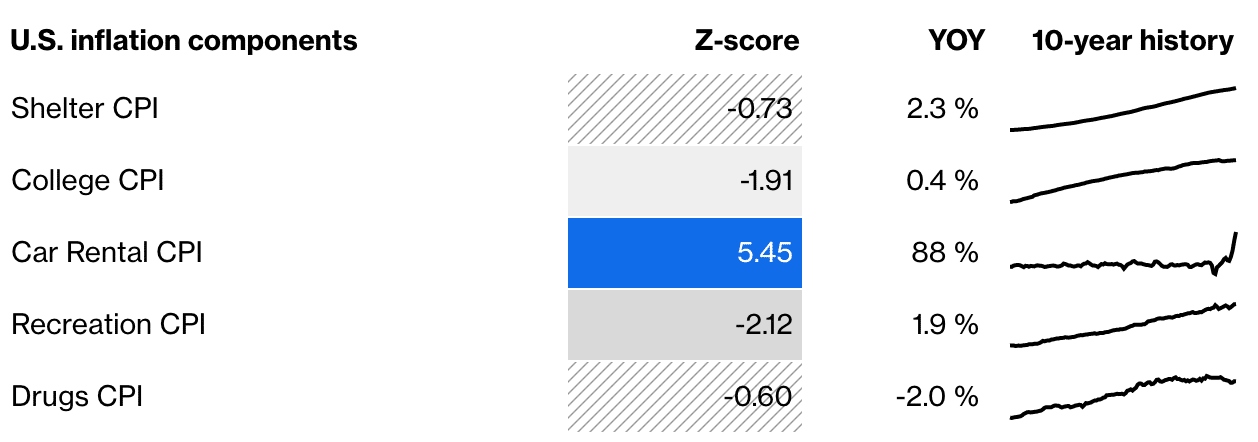
Sector-based CPI in the United States
There are two outliers: car rental and drugs. The former is up tremendously but has decreased from over 100%. One explanation for this considerable number might be that a year ago, nobody was allowed to leave the house; therefore, with zero demand, prices can be very low.
The other outlier is drugs. There can be two interpretations of this. Firstly, as we have the vaccines, fewer people are sick, and the demand for drugs could decrease. However, the more economically optimistic outlook is that there is a mixed view between sectors, and it is not clear that we are entirely in a period of high inflation.
Bond market
Bond markets are normally a good indication of inflation rates as they tend to have the most accurate consumer predictions.
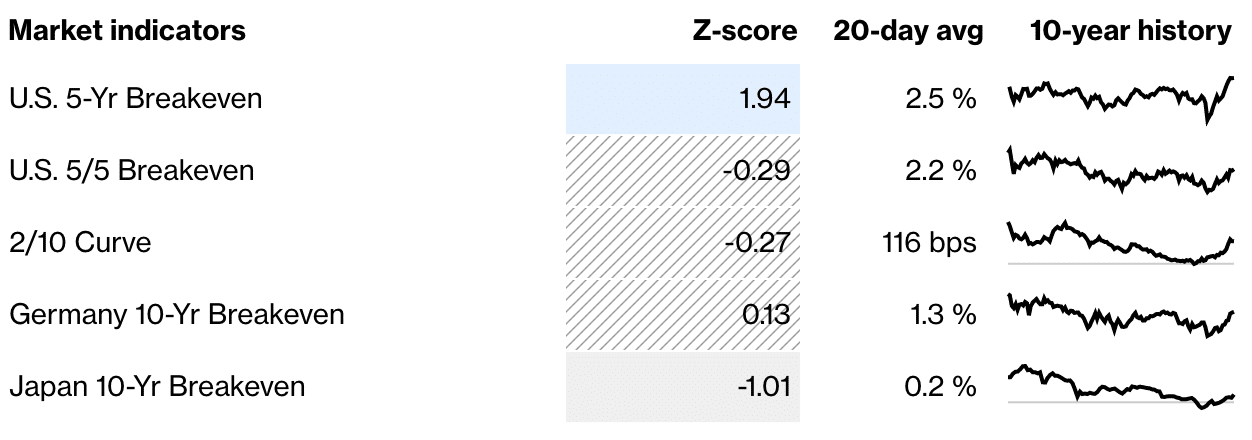
Bond market indicators in the United States
The data has been sporadic in the last few months, with 5 year break-even peaking at 2.75% then dropping to 2.4% before returning to 2.6%, according to the latest results. However, in the long term, this drops to 2.16% indicating the belief that the FED will keep inflation under control.
Business sentiments
This is the bleakest set of data with regards to the threat of inflation. All numbers are posted after 2008 highs, which is to be expected. The inflation rate is way above the range in the last decade, especially the highest for small businesses in four decades.
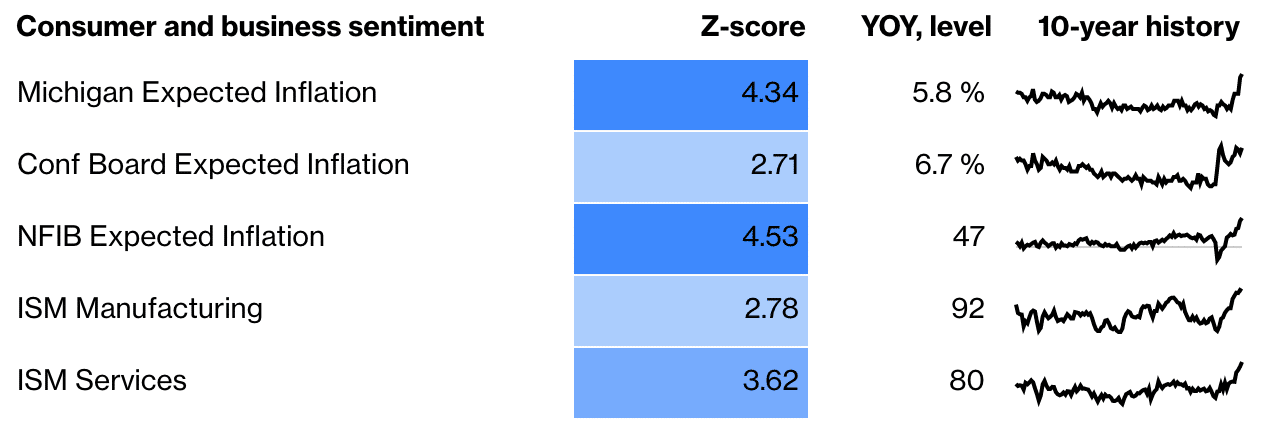
The United States Consumer and Business Sentiment
Consumer expectations also increased substantially to the highest highs since before the financial crisis. However, there are signs that the worst of this transitory phase has passed since there are signs of decline in some sectors.
Commodity prices
Commodity prices are one of the most dangerous types of inflation as it has the ability to negatively impact living standards. Higher prices mean there will be less available to build, eat and use. Lower quality alternatives might be present on the market for a lower price. However, when considering commodity prices, we need to interpret data with a bit of caution. It is not entirely representative because they are available in the futures market. The recent economic downturn might encourage speculative investors to leverage on the way up to make up for their losses.
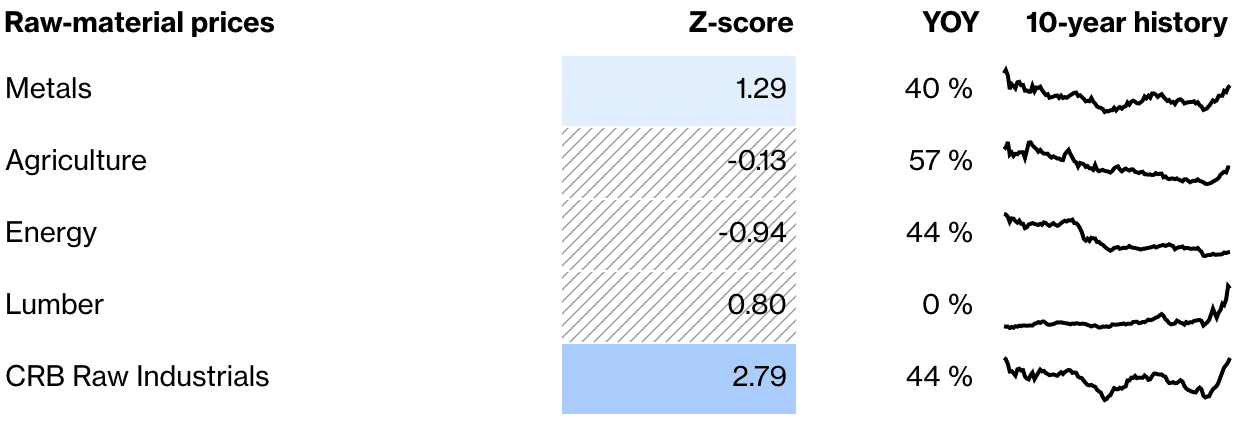
Prices of Commodities in the United States
The most inauspicious sign is probably the CRB Raw Industrials because it doesn’t include a futures market but still sees a high level of inflation. A 50% gain in the last 12 months leaves it close to an all-time high.
However, there are signs that the inflation of certain commodities has already passed its peak. Metals peaked in May and have dropped 6% since. This amount is equivalent to the drop in energy prices since the OPEC+ cartel started dealing with its problems.
What does this mean for the future
Short term
In the short run, it is likely that we will experience a continual increase in inflation. So far, the FED has been reluctant to step in as the economy is not operating to its maximum potential. Once everything is officially opened up again, the FED will likely gauge the inflation pattern and interfere with an appropriate monetary policy.
Long term
The metric that reveals the most about the rate of inflation in the future is the bond market. A low 2/10 curve represents the confidence that the FED and government will be able to keep inflation under control from 2023 onwards.
