A 15-minute trading strategy is an approach where a market participant uses a 15-minute chart to analyze and execute trades in the financial market. It can be used to trade all types of assets like cryptocurrencies, forex, and stocks. In this article, we will look at the basics of a 15-minute chart and identify some of the most popular strategies to use.
What is a 15-minute chart?
As the name suggests, a 15-minute chart is one where each bar or candlestick represents 15 minutes. Therefore, since an hour has 60 minutes, four 15-minute bars represent one hour.
The chart is mostly used by both day traders and swing traders. A day trader is a person who executes multiple trades during the day. They don’t believe in leaving their trades open in the overnight session because of the risks involved.
Swing traders, on the other hand, are people who believe in market themes. These are people who identify a trend or a trend reversal, execute trades, and then hold them for a few days. In most cases, they usually protect their trades using a stop-loss and a take-profit.
Since their trades have a longer-term horizon, these traders cannot use smaller charts like a 5-minute or a 1-minute.
So, let us look at some of the top 15-minute crypto trading strategies you can use in the market.
Reversal price action strategies
One of the most popular 15-minute trading strategy is known as reversal approach. This is a strategy where you identify a chart that is moving in a bullish or bearish direction and then place a trade in the opposite direction.
There are several ways of identifying reversals in the market. In this action, we will identify two of the most common ones that depend on price action.
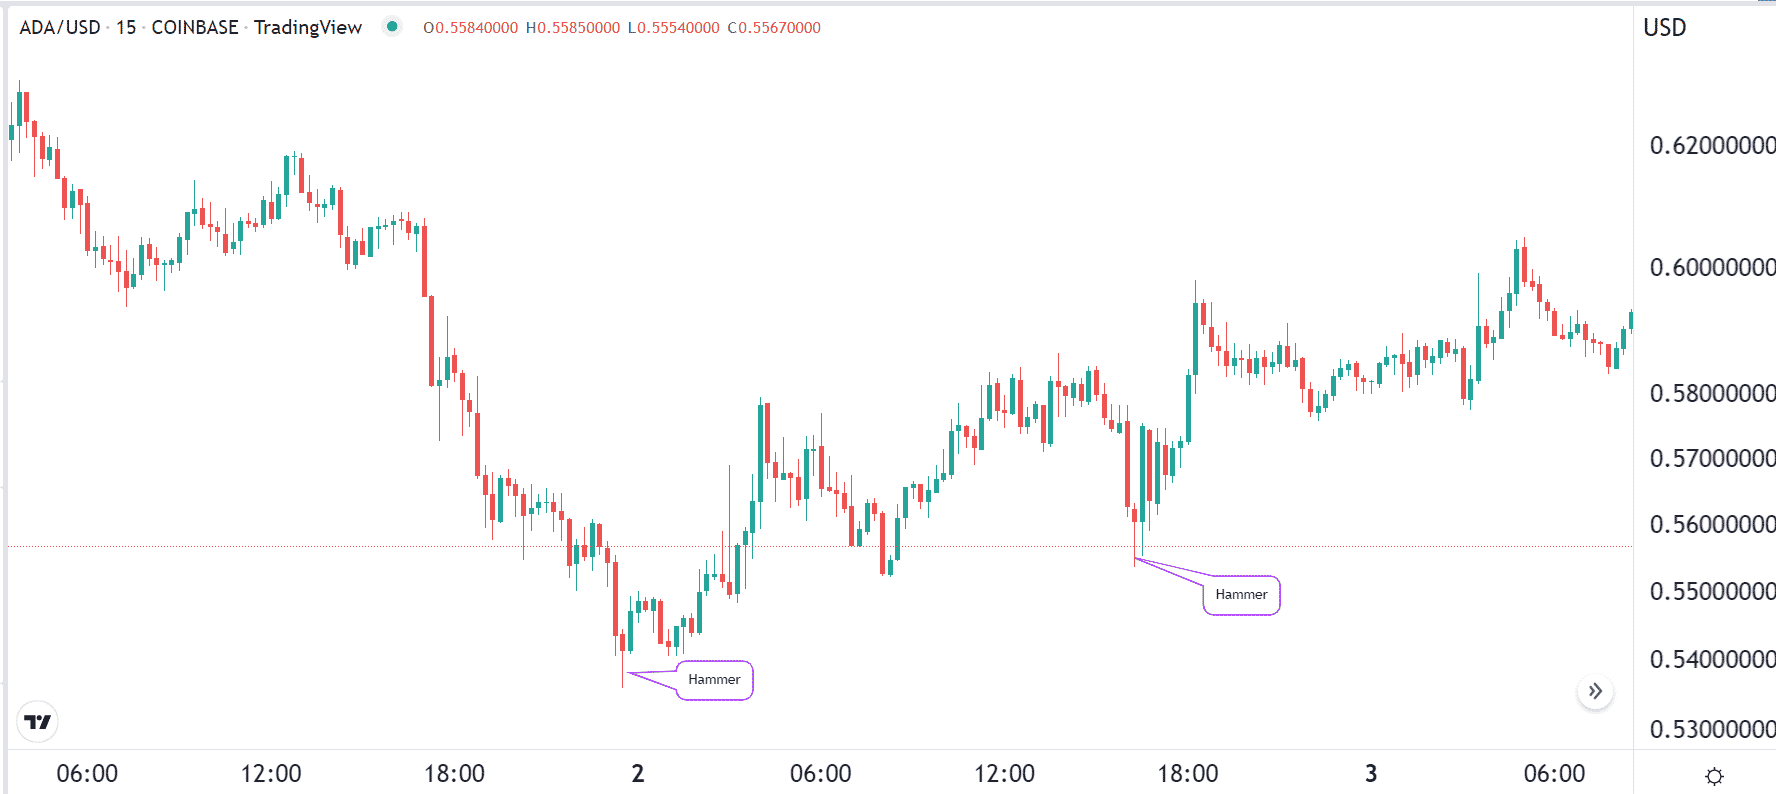
First, you can use reversal candlestick patterns to identify when a new trend is about to form. Examples of the most popular reversal patterns are doji, morning and evening star, bullish and bearish engulfing, and a hammer.
A hammer is characterized by a small body and a long lower shadow while a doji is made up of a tiny body. In a bullish engulfing pattern, a small bearish candle is completely engulfed by a large bullish candle. The chart below shows how hammer patterns signaled the beginning of a new bullish trend.
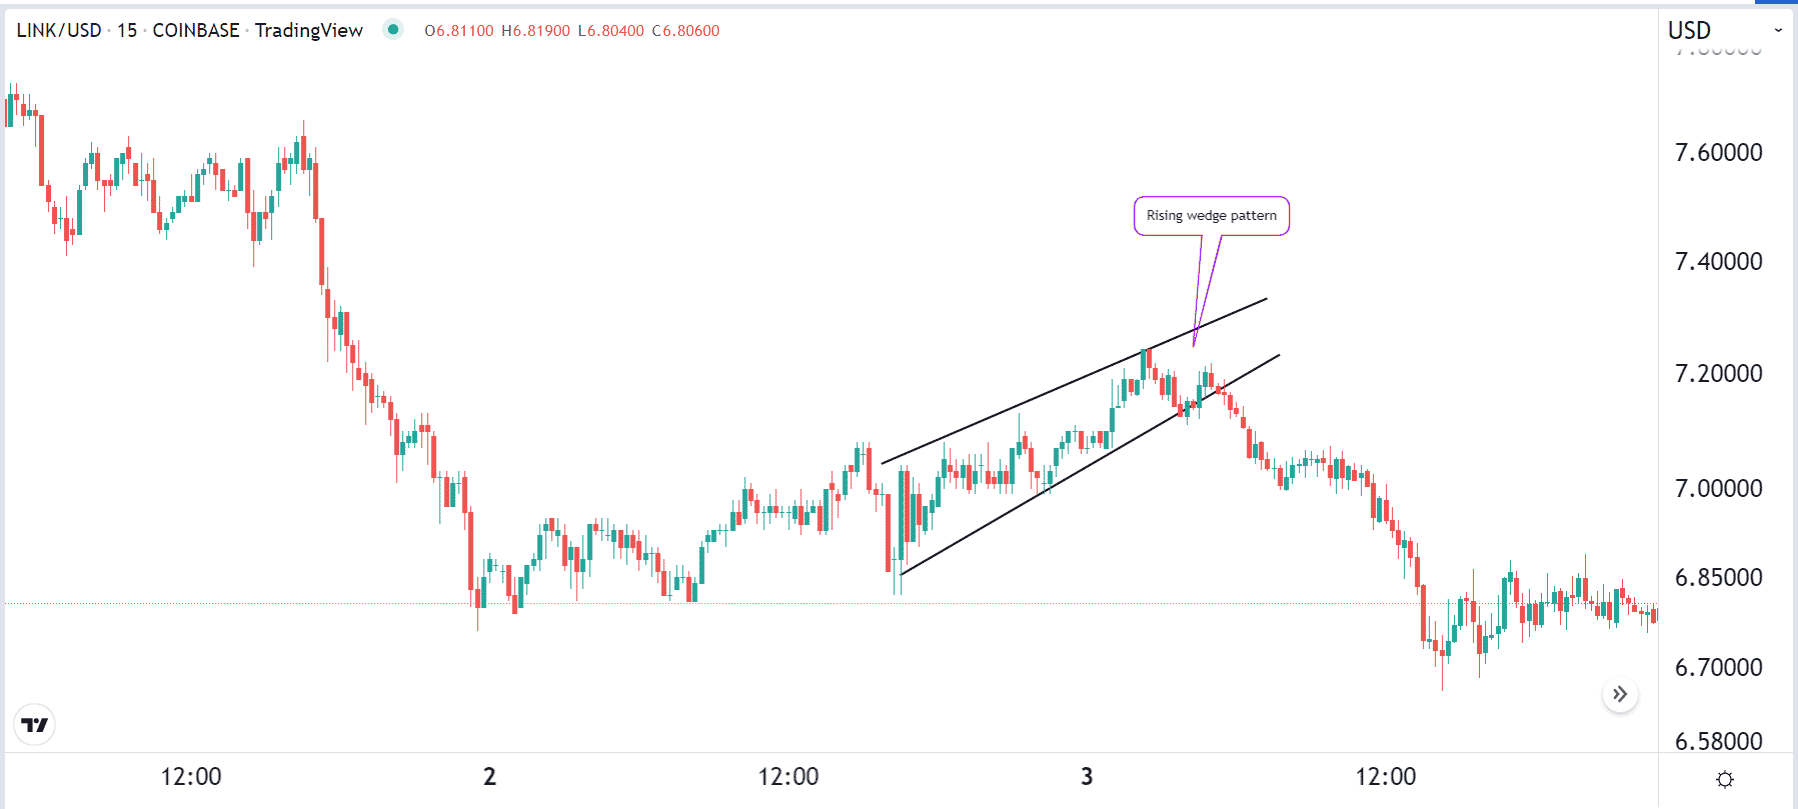
Second, you can use reversal chart patterns. These are chart patterns that signal the beginning of new trends. Some of the most popular reversal patterns are double and triple-top patterns, rising and falling wedge and head and shoulders pattern.
When these chart patterns happen, it is usually a sign that a new trend is about to form. In the chart below, we see that a new bearish trend formed when the coin formed a rising wedge pattern.
Continuation patterns
The opposite of reversal patterns is known as continuation patterns. When these formations happen, it is usually a sign that a bullish or bearish trend will continue.
Like reversal patterns, there are two main types of them. First, 15-minute chart traders focus on continuation candlesticks. Examples of these patterns are three white soldiers and three black crows. These patterns are not as common though.
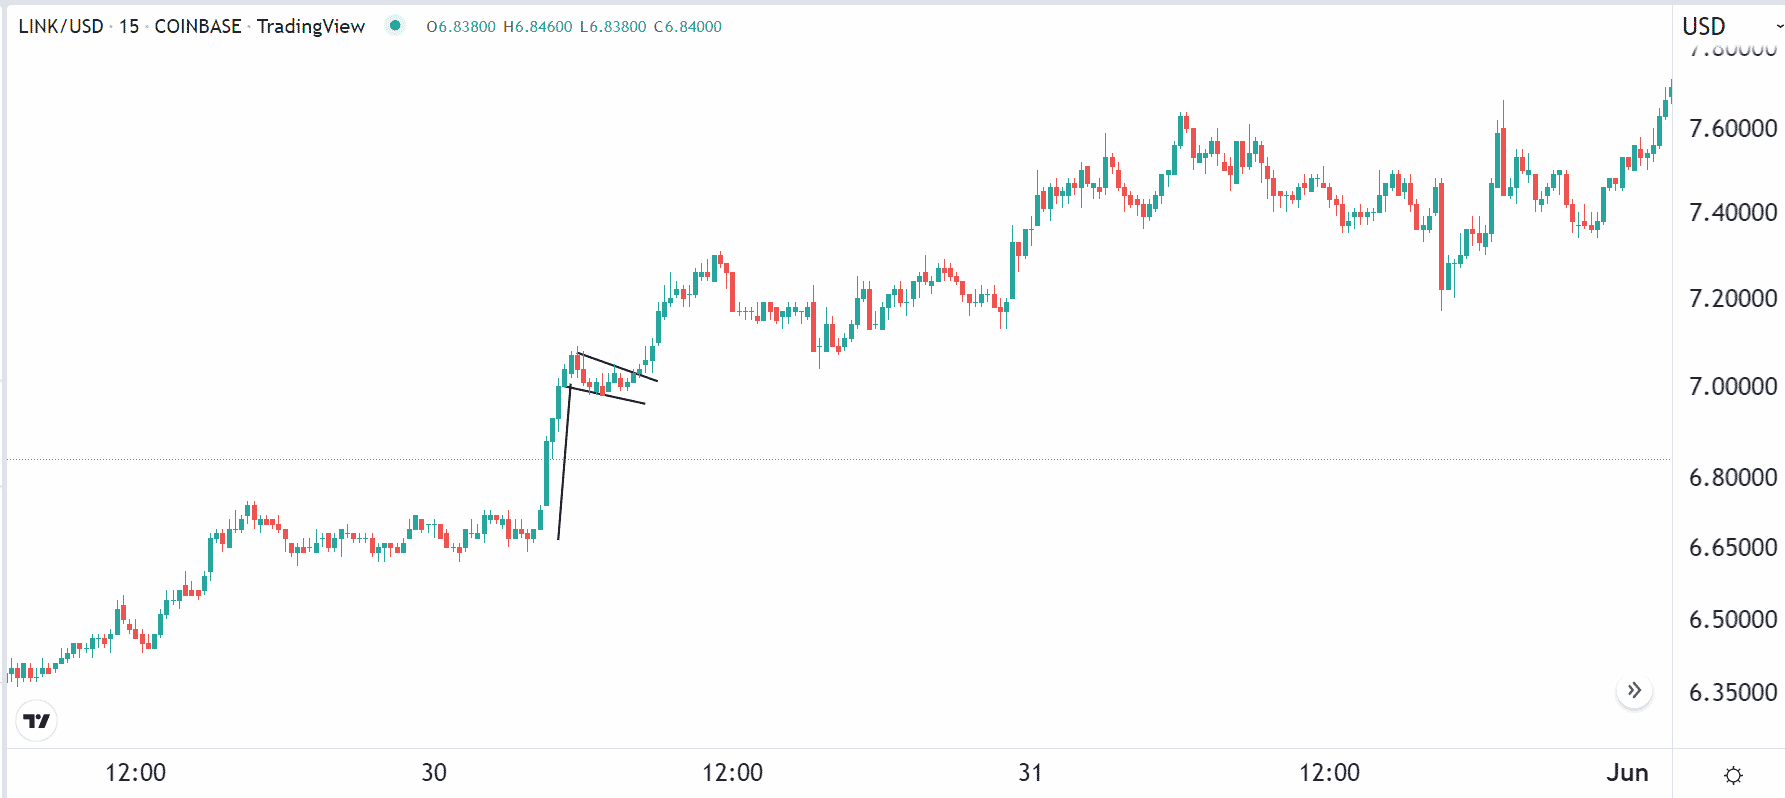
Second, there are continuation chart patterns like bullish and bearish flags, bullish and bearish pennants, and ascending and descending triangle patterns. When these patterns form, they usually signal that the original trend will continue. The chart below shows an example of a bullish flag pattern.
Trend following
Another 15-minute trading strategy is known as trend-following. It is a strategy that involves buying a cryptocurrency or any other asset when its price is rising and selling one whose price is falling. The idea is based on Newton’s law of motion that implies that an item in motion will continue moving in the same trend until it finds a force in the opposite direction.
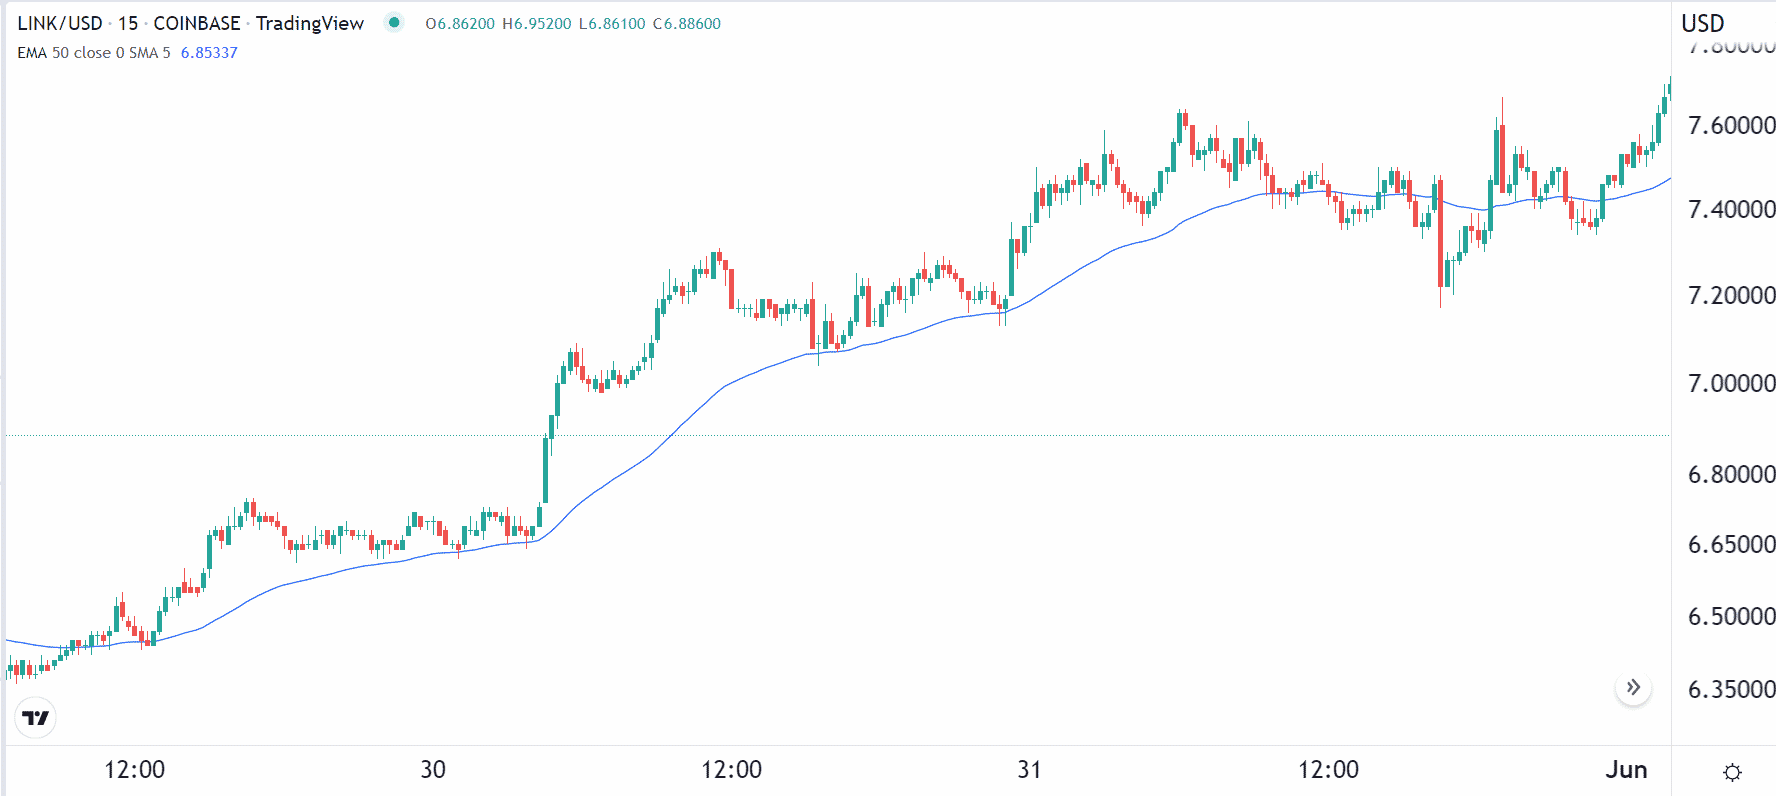
For trend-following to work, an asset needs to be moving in an upward or downward direction. In other words, a trader should not attempt to move against the trend. For example, in the chart above, we see that Chainlink is in a bullish trend. Therefore, a trader can buy the coin and hold it until it starts to reverse.
A better approach to use is to use a trailing stop, which is a type of a stop-loss that moves with the cryptocurrency. The idea is that it will capture profits if there is a major reversal.
Additionally, many traders use trend-following indicators like moving averages and Bollinger Bands. When using a moving average indicator, the bullish or bearish trend will continue as long as the coin is above the price.
Channel trading strategy
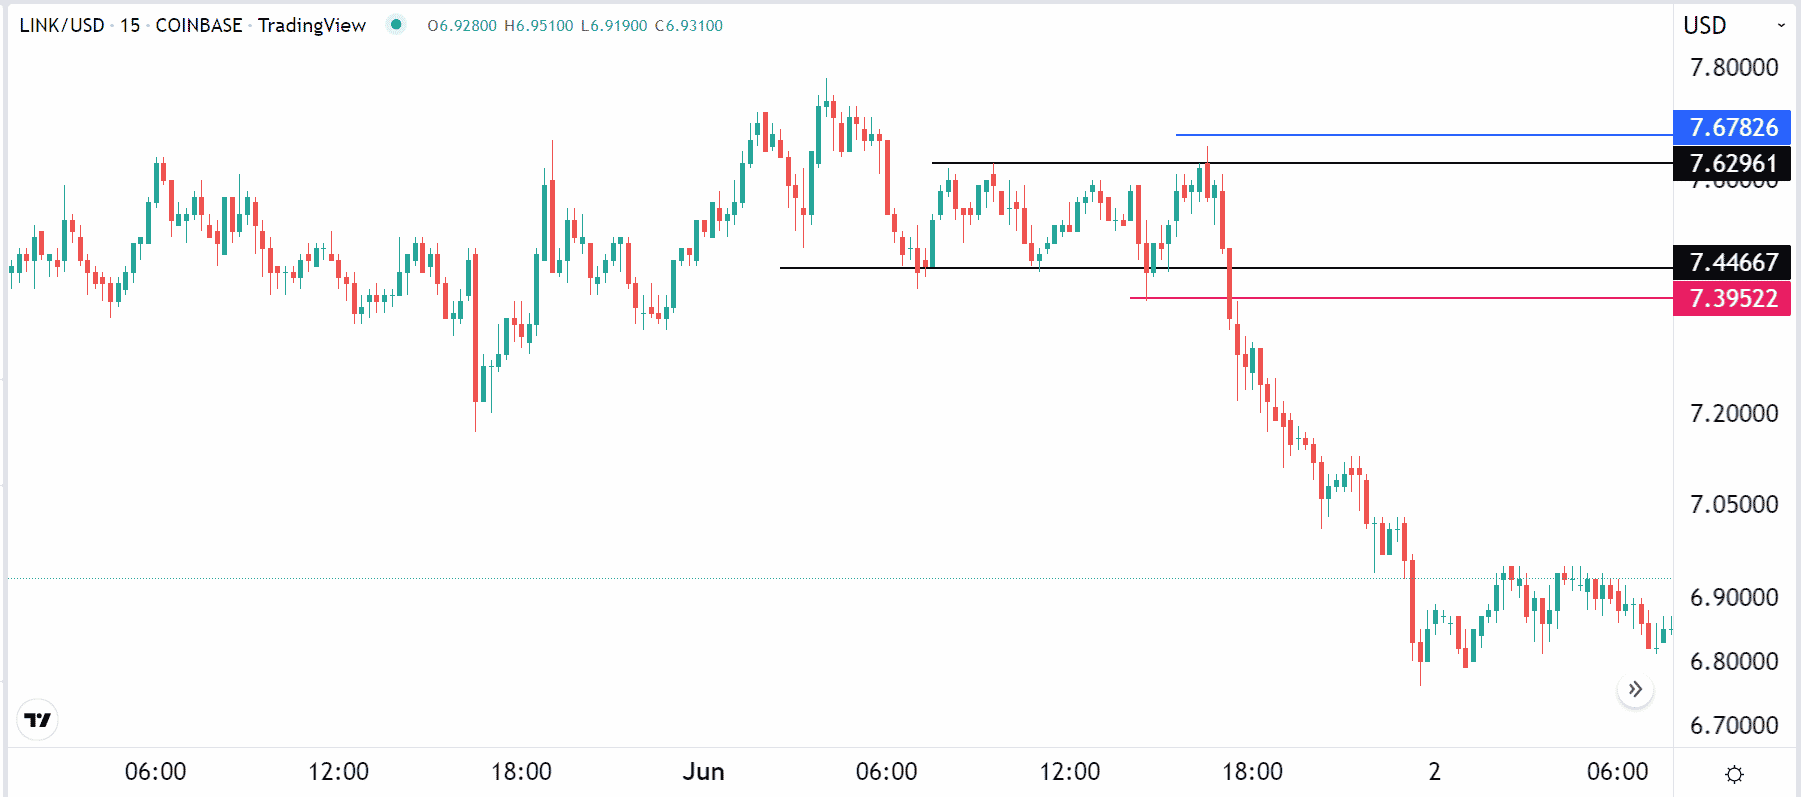
The other 15-minute trading strategy is one that uses channels. A channel is drawn by drawing a horizontal line at the support and another one at the resistance level. With this channel drawn, you can buy the coin when it moves to the support and then exit when it moves to the resistance level. The idea is that the coin will remain in this range for a while.
A better approach to trading channels is to use the breakouts that happen after every channel pattern. One of the simplest approaches is to set a bracket order above and below the coin. For example, in the chart below, you could have set a sell-stop trade at $7.39 and a buy-stop at $7.67. After doing this, you could protect the two trades with a stop loss and a take-profit.
Now, if there is a bearish breakout, the sell-stop trade will be executed, and the buy-stop was not. As such, one can follow this trend.
Summary
In this article, we have looked at what a 15-minute trading strategy is and how it works. We have also assessed some of the most important strategies to use when using the approach. Other important technical indicators to use when using the 15-minute chart are the Relative Strength Index and VWAP.
