Charts are the backbone of forex trading. In stocks, it is possible to succeed without using charts since there are tools like time & sales, level 2 data, order flow information. In forex, it is almost impossible to succeed without looking at charts. In this article, we will look at four types of charts and how you can use them in trading.
Line chart
Line charts are the most basic type of charts you will find in the forex market. They are provided by most trading platforms like TradingView and even MetaTrader.
Ideally, a line chart is one that shows you the overall trend of a currency pair without any other details. As a result, line charts are used when too many details are not necessary. As a result, they are mostly used to illustrate whether the pair is moving upwards, downwards, or sideways.
By default, a line chart maps the closing price of an asset. However, using advanced trading tools, it is possible to change all this. You can use it to show:
- Open. A line chart can indicate the opening price of a currency pair.
- High. It can show the highest level of a pair in a certain period.
- Low. This one shows the lowest price during the session.
- (H+L)/2. This line shows the average price of the currency pair. You can compute it by adding the highest and lowest levels and then dividing it by two.
- (H+L+C)/3. This line chart is drawn by adding the high, low, and closing price and then dividing it by three.
- (O+H+L+C)/4. It is drawn by adding the open, high, low, and closing prices and dividing the result by 4.
In most cases, line charts will not be necessary when you are conducting a technical analysis. That’s because, as you will see below, these charts don’t give all the necessary information.
The chart below shows the USD/SEK pair mapped with the open price, OHLC, and Low price, respectively.
USD/SEK line chart

Candlestick charts
Candlesticks are the most common chart patterns used in forex trading. That’s because the charts usually give a wealth of information compared to most other patterns.
Interestingly, according to Steve Nison, author of Beyond Candlesticks, these charts started being used around 1600 in Japan’s rice market. Today, candlesticks are used across the market segments.
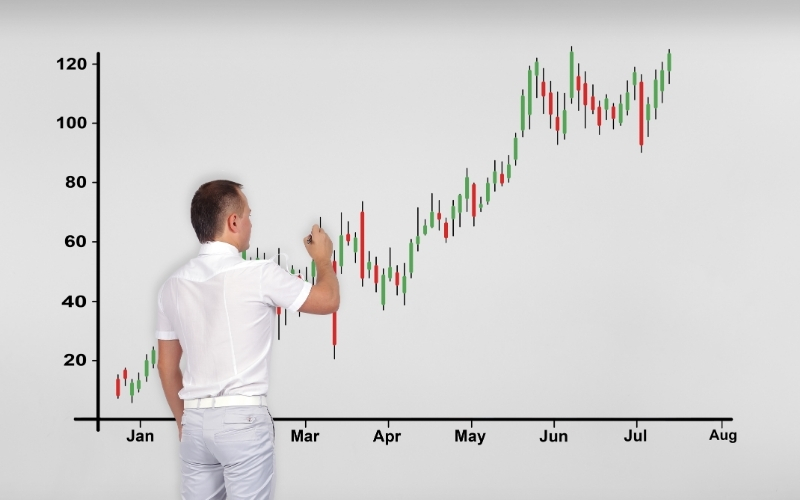
A candlestick has several key parts, as shown in the chart below:

The most important parts of the charts are the upper and lower shadows and the body. The uppermost part of the upper shadow represents the highest point of the asset during a certain period. For example, if you are looking at the daily chart, the topmost part of the candlestick is the highest part during that day.
Similarly, if you are looking at the hourly chart, that is the highest point during that hour. Similarly, the lowest part of the lower shadow shows the lowest point during that session.
Between the shadows is the real body of the price. It represents the range between the market open and close.
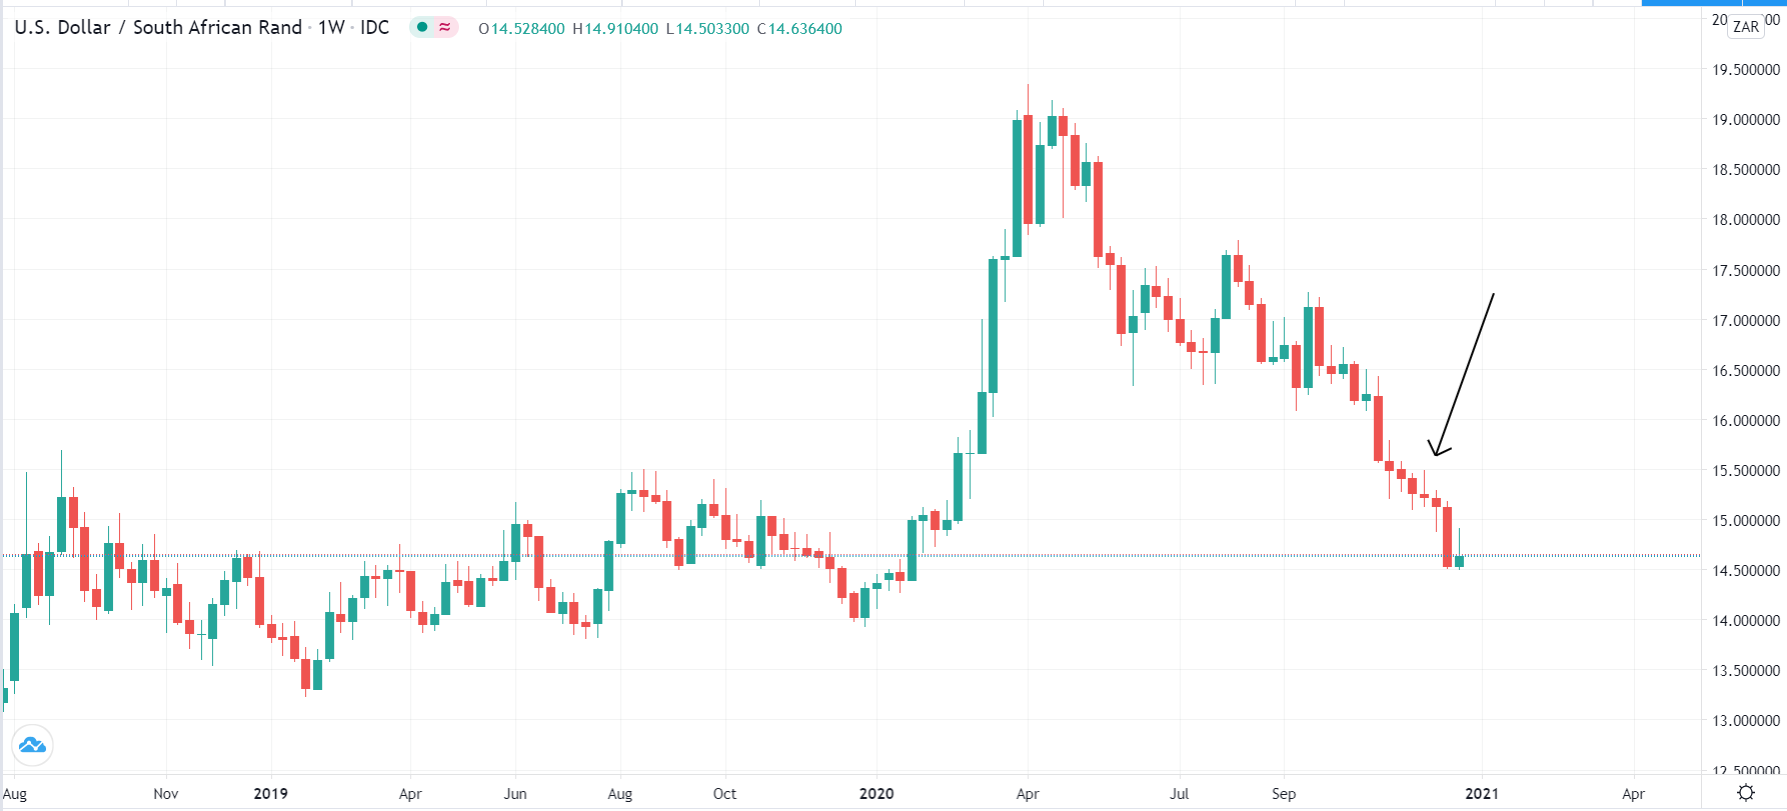
Therefore, candlesticks are important because of the vast amount of information that they carry. For example, looking at the weekly chart of the USD/ZAR pair, we see that it dropped in the past seven consecutive weeks.
There are several benefits of using candlesticks:
- They give more details like the open, high, closing, and lowest points of a pair.
- Using candlestick patterns like doji, hammer, and engulfing can help in predicting future prices.
- They are easy to use, i.e., the color alone can give you more details.
- Drawing support and resistance levels is easier with candlesticks.
Kagi charts
Like candlesticks, Kagi charts were invented in Japan in the 1870s. Indeed, the name Kagi stands for an ancient key in Japan. These charts are relatively more complicated than the line charts and candlestick patterns. In fact, they are not provided by default in the popular charting tools like MetaTrader and TradingView.
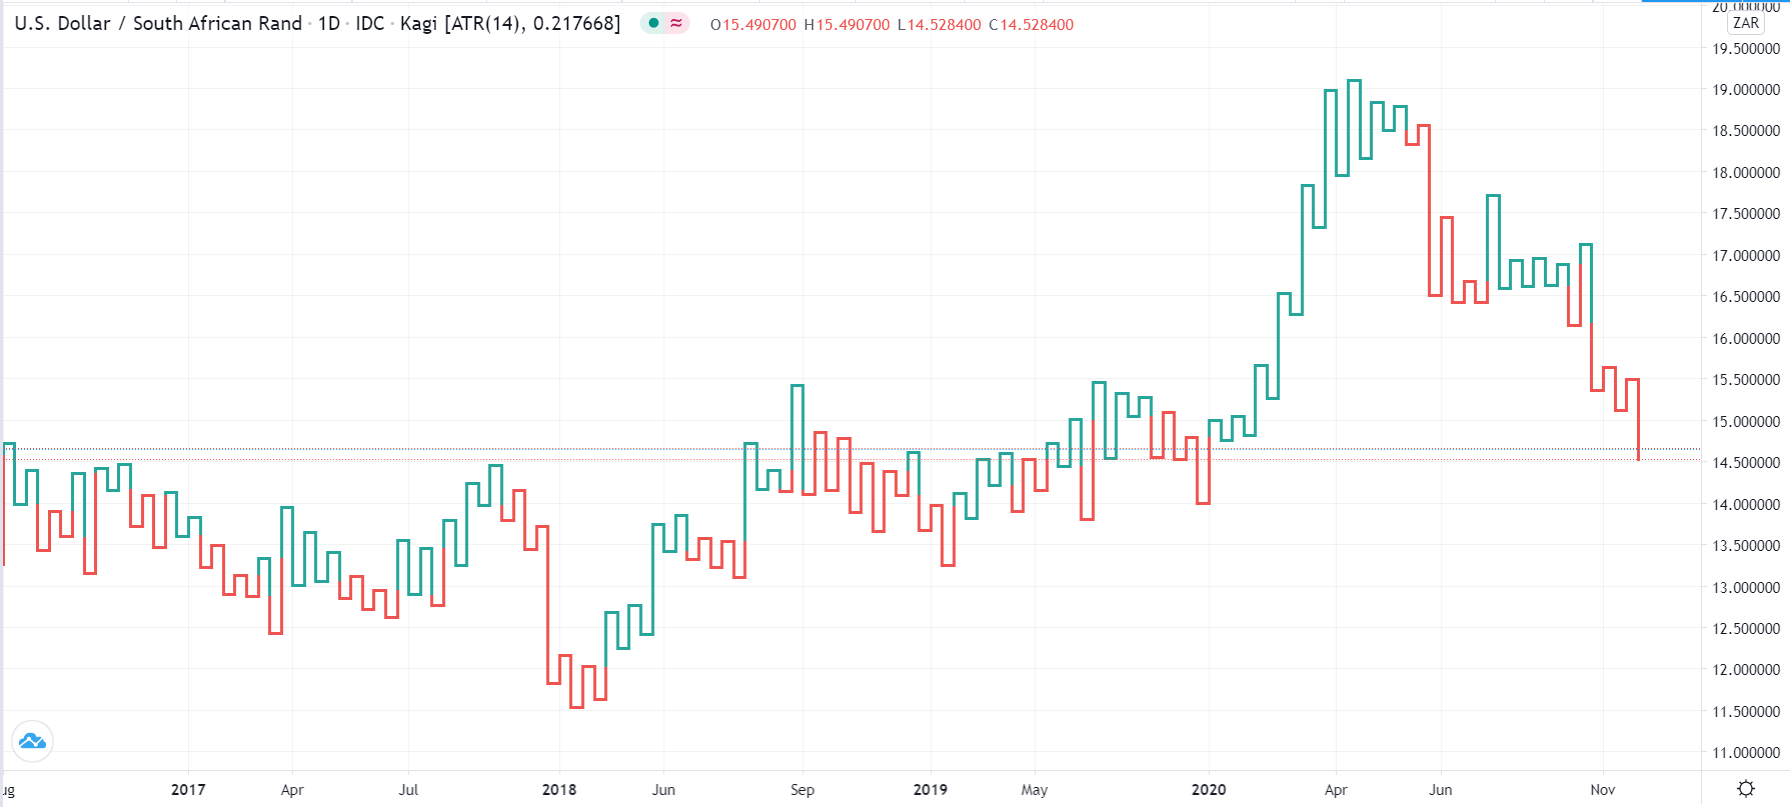
Kagi lines are based on the premise that the thickness and the direction of the charts are only dependent on the market action. In this case, if the market reverses by a certain amount, a new Kagi line will be drawn. The thick line of the chart is known as the yang, while the thin line is known as the yin. In the figure below, they differ in color, red for yin and green for yang, rather than in thickness.
Traders use several approaches when using the Kagi charts. First, they buy on the yang and sell on the yin. The Kagi becomes thick when the previous high is exceeded and then converts to a thin yin when the previous low is broken.
Another approach to using the Kagi pattern is to use the shoulders and waists. A shoulder is usually the prior high, while the waist is the former low. There are several benefits of using the Kagi lines.
The main benefit of using Kagi lines is that it is relatively easy to use. It is also easy to combine with other technical indicators like moving averages and relative strength index. The only con is that Kagis are not provided by default in most trading platforms.
Point & figure chart
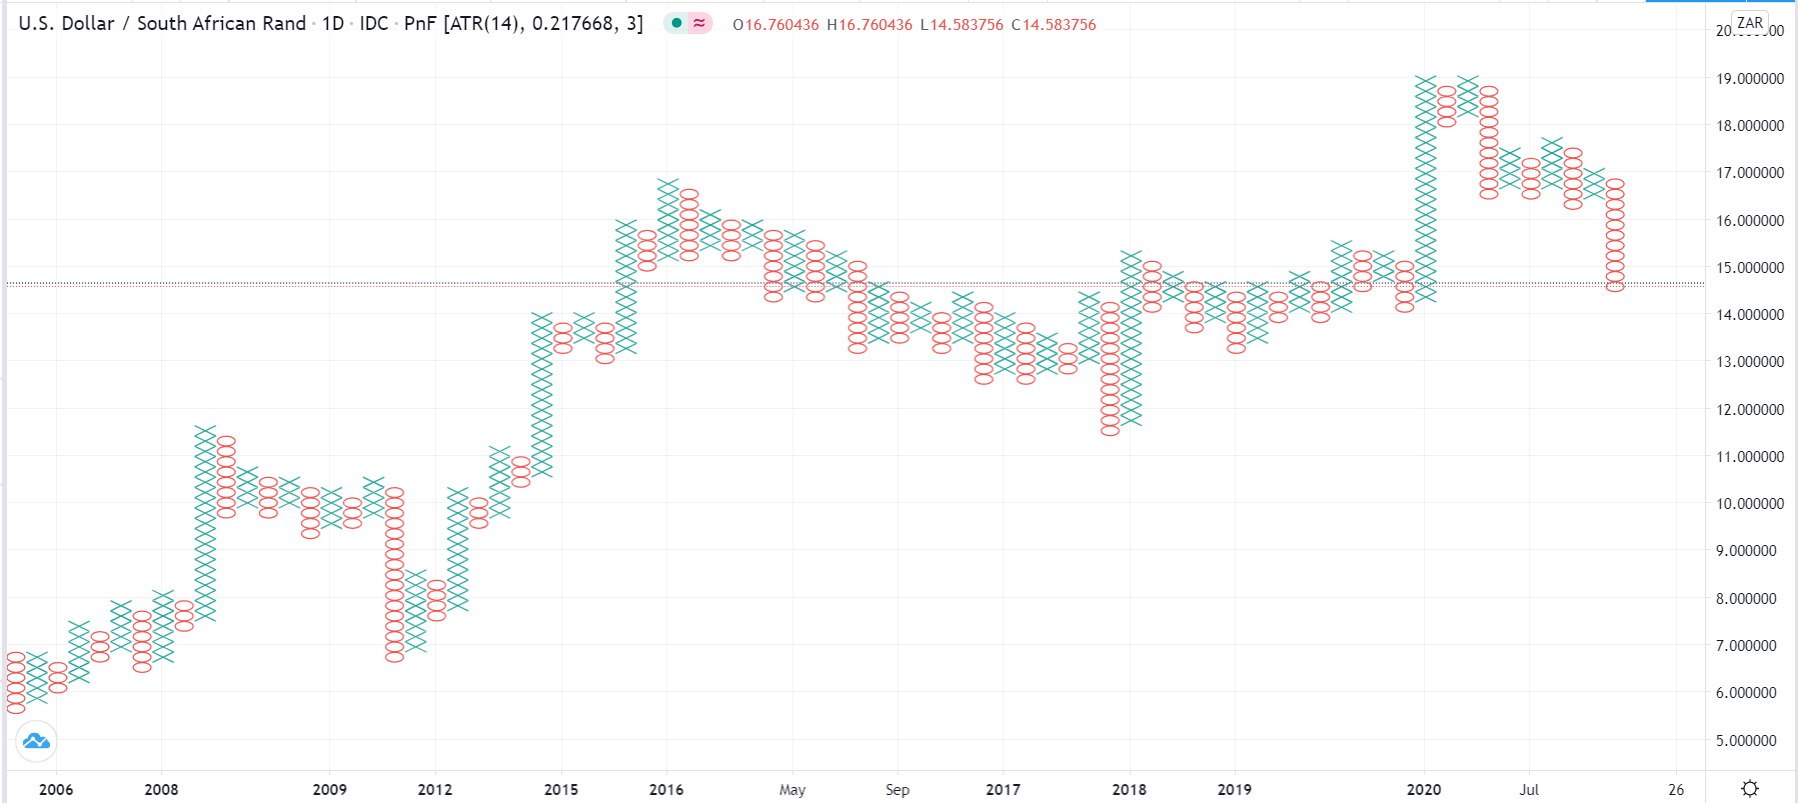
Point and figure patterns are relatively complicated types of chart patterns that contain Xs and Os. X columns are indicators of rising prices, while Os represent falling prices. A key difference between P&Fs and other types of charts is that the former removes the factor or noise of time. As a result, they focus on price movements, make support, and resistance levels easy to identify, and provide easier trendlines.
Traders use point & figure to identify support and resistance and upward and downward trendlines. The main disadvantages of using these patterns are that they are not available in charting platforms like MT4. While they are available in TradingView, you cannot use less than the daily chart in the free version.
Point & Figure on the USD/ZAR pair
Final thoughts
In this article, we have looked at the four most common types of chart patterns. You can use other types of charts: Renko, range charts, area charts, Heikin Ashi, and line break charts. Apart from candlestick patterns, all these other types of charts are used by advanced traders.