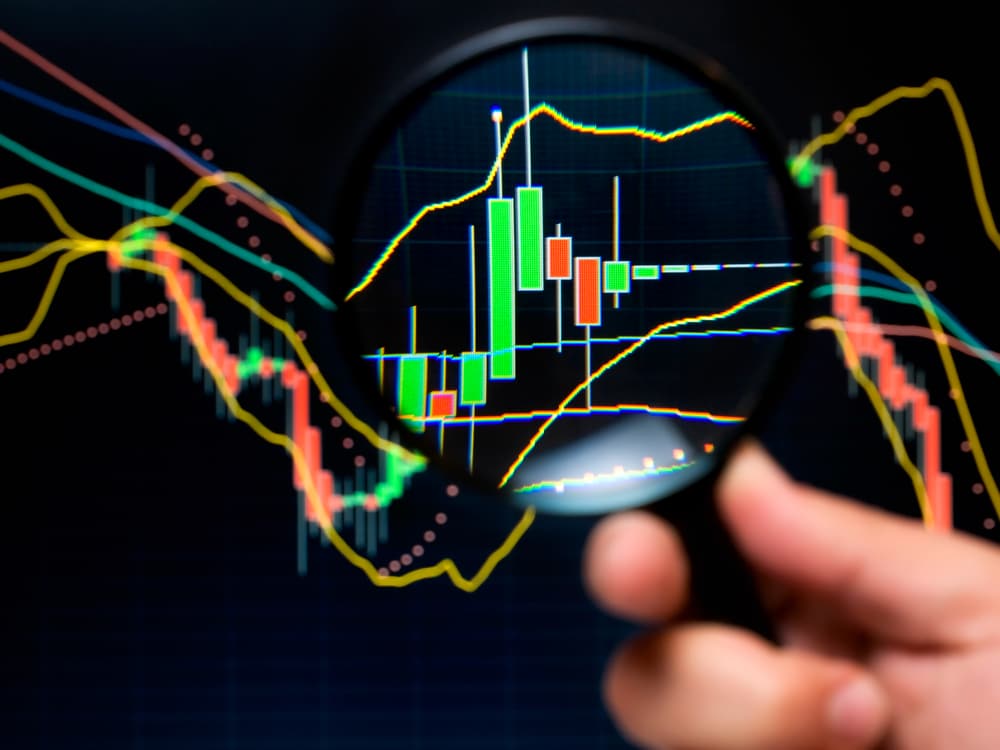
Technical analysis is a broad field of study, encompassing several subsets. As a technical analyst, one’s main point of reference is the price. Technical analysts believe all the current market information they need is in the price.
Of course, there is a lot more about the price than just simply going up or down. Traders will typically consider the trend, momentum, and volatility before making any trading decision.
These are the popular concepts of price forming part of any trader’s technical analysis, which this article will further explore.
Trend
‘The trend is your friend’ is a well-known saying prevalent in many financial markets. For a vast majority of traders, the trend is their first consideration when conducting technical analysis.
It is the driver behind price movements primarily because of the herd mentality or crowd psychology; the more people see something going up, the higher chance for price to continue in that direction (and vice versa for bear markets).
Put simply, trend refers to the propensity for the price to move up or down over a defined period.
More specifically, we characterize an uptrend when a market makes several consecutive higher highs and higher lows within a specific time frame; a downtrend needs an instrument to make several successive lower lows and lower highs within a particular time frame.
These are the common definitions anyone finds in much of the trading literature, although they are slightly flawed and highly subjective. There are so many trends occurring at any time and a plethora of time-frames to refer to.
Furthermore, even in so-called strong trends, no market moves in one direction indefinitely because of retracements or pullbacks.
Tools used in identifying trends
Traders attempt to tackle the above dilemma by firstly typically referring to one time frame as their dominant trend. The more frequently someone trades, the likelier they will refer to smaller charts like the 1M, 5M, and 15M. As the trading frequency reduces, the higher up in time frame a trader will go.
Regarding the tools, one may use a combination of drawing techniques or the default indicators available on their trading platform. For charting, popular methods include trendlines, support, and resistance, identifying swing highs and swing lows, candlestick patterns, etc.
For indicators, the most popular options here include the likes of moving averages, MACD (moving average convergence divergence), Parabolic SAR, Bollinger Bands, and so on.
Momentum
While the trend deals with directional bias, momentum refers to the strength or weakness of trends. It seeks to examine the acceleration and deceleration of price critically.
Similar to the physics definition, momentum is all about the ‘volume of motion’ of price moving up or down, a velocity measurement of buying and selling pressure. For example, a strong downtrend exhibits powerful bearish momentum because of how the price accelerated.
Trends move in waves and often make substantial pullbacks in the opposite direction, which is the deceleration part. Understanding this element of price is critical for a few reasons.
For instance, when a particular market has moved aggressively upwards for an extended period, it is not always the best place to go long (and vice versa for downtrends). While the momentum would dictate the probability of the new trend-making highs or lows, it also suggests a possible pullback of some magnitude.
Another popular concept of momentum is divergence, a unique feature only found in oscillators, which are the primary tools for observing momentum. Divergence is a technical mismatch between the lows and highs of price and those reflected by the indicator.
The recurring belief is when this occurs, there is a likelihood of a reversal.
Tools used in identifying momentum
Unlike trends, traders observe momentum primarily using indicators, most of which are oscillators. The most well-known options in this regard include the Relative Strength Index (RSI), stochastics, and MACD.
Volatility
Volatility is somewhat similar to magnitude, except the former is a measurement of how drastically prices change. Every forex instrument moves in predictable ranges on any timespan.
When price moves high above these points, we consider the high volatility; conversely, when it moves significantly lower than these ranges, this suggests low volatility. High volatility tells us a particular instrument has covered much more ground than it usually does, and vice versa when volatility is low.
Traders utilize this aspect of price to speculate the magnitude to which it might change in the future. Volatility is also critical for setting stop losses as traders attempt to place them above a certain range to account for fluctuations appropriately.
Not only for these reasons, but it can also help them decide the markets they should trade as part of their portfolio.
For instance, we consider major and minor pairs as more stable where volatility is consistent with few surprises. Liquidity is higher because there is a much bigger demand for trading purposes, thereby making the transaction costs reasonable.
This is unlike exotic pairs that tend to be more volatile primarily because fewer traders speculate in these markets. Thus, the spreads are often a lot higher due to lower demand. However, high volatility is not always a bad thing and is actually necessary for maximizing profits.
Tools used in identifying volatility
The most commonly utilized indicators for studying volatility are the Average True Range (ATR) and Bollinger Bands.
Final word
Whether a trader is conscious of it or not, they will use some combination of examining trend, momentum, and volatility in the markets. It is vital to incorporate these concepts holistically to ensure more solid trading decisions.
As with anything, it is never wise to execute a position just off one signal; it takes a lot more.
