
Technical analysis in trading has its roots buried in the charts. Japanese candlesticks and other forms of famous bars are built on the specific time frames which you choose. Each candle shows the price fluctuation within that particular interval.
Technical, Fundamental, price action, algorithmic traders, etc., all use various minutes, hours, daily, weekly, or even monthly charts to help them get the best possible setup.
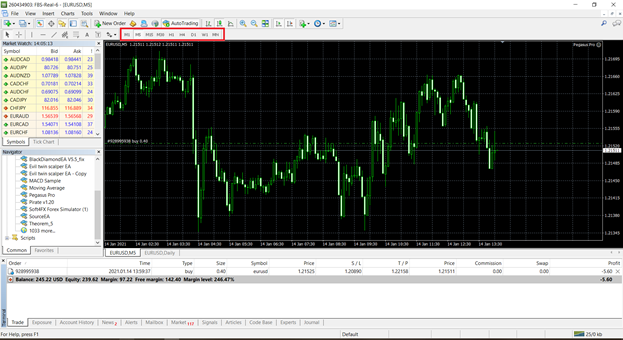
Major time frames
Depending on the market you are trading and your style, the major time frames may vary. Nonetheless, a few are industry standard, which is also available in top trading software and charting platforms:
- M1 (1 minute)
- M5 (5 minutes)
- M15 (15 minutes)
- M30 (30 minutes)
- H1 (60 minutes or 1 hour)
- H4 (240 minutes or 4 hours)
- D (24 hours)
- W (7 days)
- M (1 month)
Other than these, a trader can also build up his own custom time frame if the charting station supports it.
Trading and related time frames
The kind of trader you are and the time frames you trade in have a deep relationship. Scalpers usually prefer to stay on lower periods such as M1, M5, and M15 as it helps them clear out the noise and see more details. People who day trade are on higher intervals like M30, H1, and H4, while swing and carry traders focus on Daily, Weekly, and Monthly charts. Expert advisors and indicators work on specific timescales and only show their best on those.
Many novices in the industry spend a lot of effort in trying out various time frames and eventually ending their career in disappointment. Using multiple scales to leverage your hand in the market is considered a thing of professionals who have spent years in the financial niche. However, that is not the case, as, through learning and practicing, a beginner can also get the upper hand.
Studying charts and time frames
Let’s look at a few examples of swing and day trading and their relationship with intervals by analyzing various charts.
Swing trading
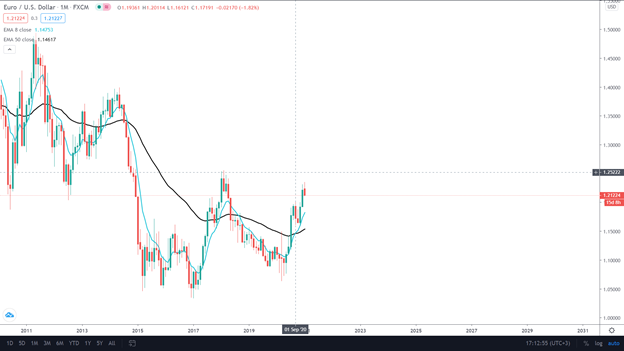
Many strategies give a higher probability of success if you use multiple time frames. We will focus on a single indicator (exponential moving averages) and an engulfing candle pattern to make everything look simple for our swing analysis. The basic idea is to take a position when EMA 8 crosses over EMA 50, a sell if it’s from top to bottom and vice versa. Bullish and bearish engulfing patterns and lower time frames are under observation for further confirmation.
As soon as we get the buy signal, we go to a lower time frame to get more verifications.
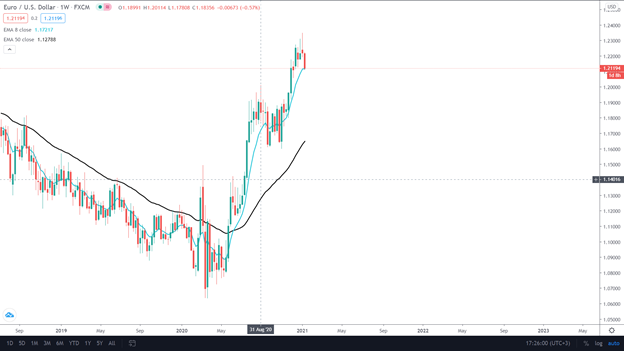
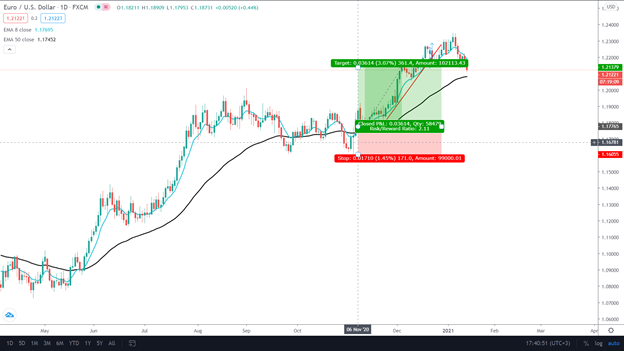
In swing trading, the lowest possible time frame under observation is daily. Depending on your game plan, you can hold your position for days, weeks, or even months. Let us look at the daily chart and see what we get.
Day trading
In day trading, one is focused more on short-term positions that begin and end within 24 hours. Their position size is relatively much larger than swing traders at the same risk point as they have lower stop loss and take profit levels. Most of the price action traders are seen day trading stocks and the forex market. Therefore, it’ll be our primary example for multiple time frame analysis.
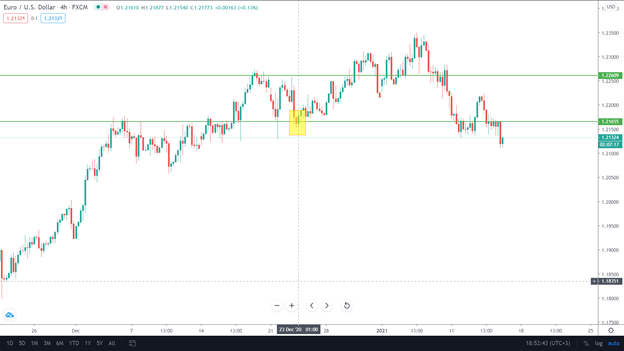
After analyzing the H4 time frame, the next best thing is to go down to H1 and see what the charts say.
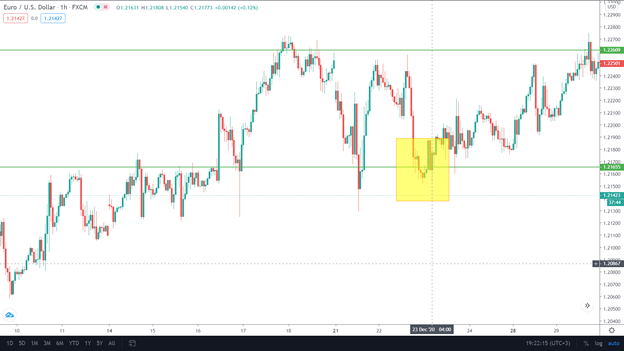
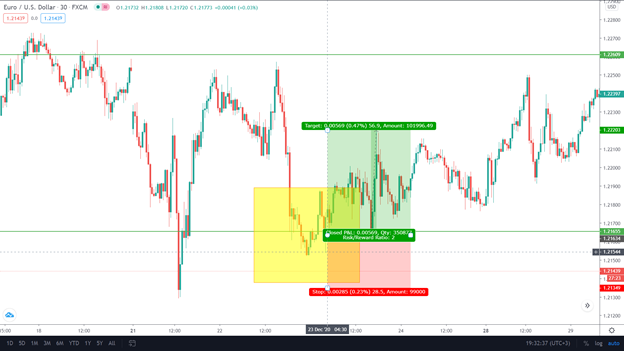
Switching the interval to M30 day, traders can get in on a trade at a razor-shaped entry.
Is it always beneficial to use multiple time frames?
The demerit associated with multiple time frames is that you may get fewer setups as you search for numerous confirmations. A few might get confused between the process, which can negatively affect psychology and therefore trading. You also have to find a strategy that would work correctly with such sort of analysis.
On the other side, several time intervals do have a lot of benefits. It allows you to get in your trade at an excellent entry point with absolutely no drawdown in best cases. Getting out of a position is also calibrated. Strong support and resistance levels are determined, and a high probability of winning is at one’s disposal. Novice traders may find it hard at first to grasp this simple yet effective method to boost their gains. It takes time and devotion, but once you grab it, it’ll work wonders in your trading and keep you in the winning 10%.