
Trend trading is one of the most popular strategies since it allows traders to identify, isolate, and take advantage of trends for profit. In this guide, we take a look at how a trader can get started with trend trading as well as utilize the top three trend trading indicators.
What is Trend Trading?
Trend trading is basically a strategy, which allows traders to utilize technical indicators to recognize the market momentum in a particular direction. Since markets tend to have some element of predictability, a trader can forecast what could happen in the future by using and analyzing price movements and historical trends.
Depending on how long a particular trend lasts, trend trading can cover any timeframe; although it is used mainly as a mid to long-term strategy. Most of the time, traders who prefer swing trading or position trading tend to adopt this strategy. Swing traders recognize a trend and ride it all the way from beginning to end, while position traders hold a trade for the duration of the prevailing trend while ignoring day-to-day fluctuations.
Identifying a Trend
Such trend trading strategies allow traders to recognize trends as soon as possible so that they can exit markets before the trends reverse. Through the identification of opening and closing prices as well as the trading range of different indicators, traders can amass information. This allows them to recognize the highs and lows of the trend.
Generally, there are three primary trend types. These are as follows:
- Uptrend
- Downtrend
- Range or Sideways trend
Uptrend
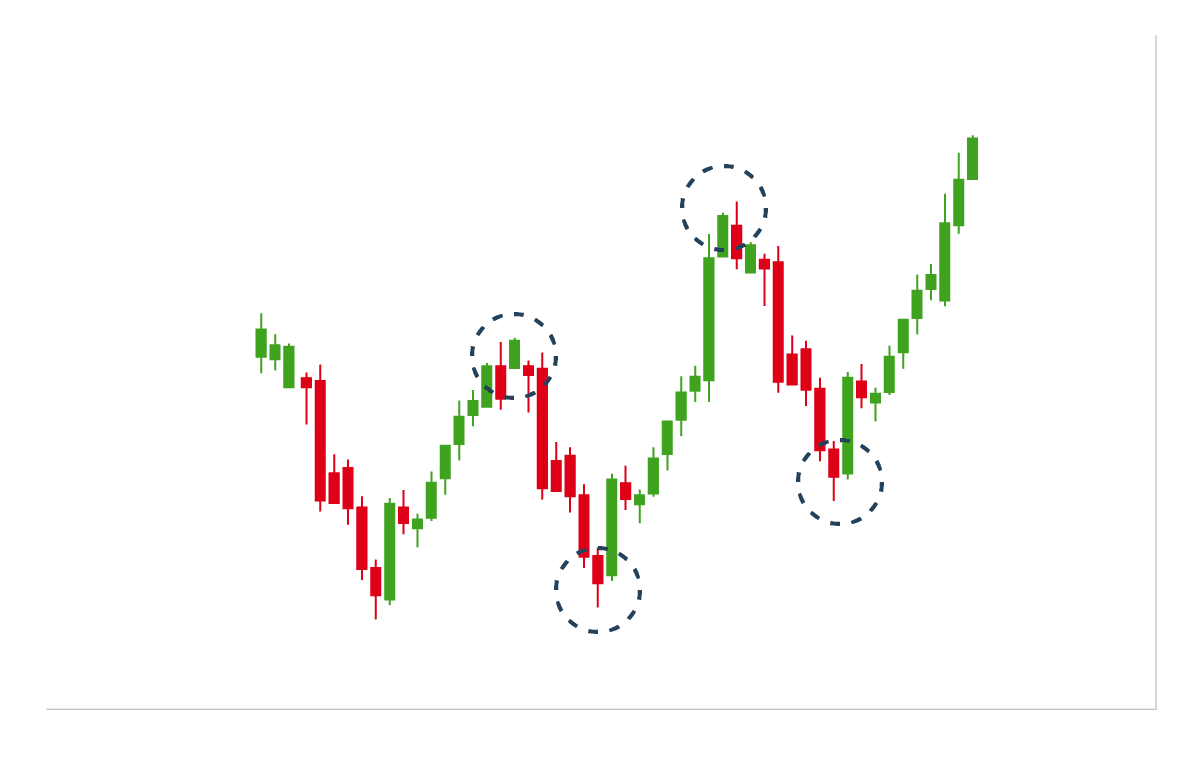
Uptrends are highlighted by an increase in the market price value. When traders are looking to gain an advantage through these movements, they enter a long position as the market reaches progressively high price levels. These caused by investor optimism about the market scenarios and are considered as a ‘bullish’ trend which is marked by both higher highs and higher lows. The graphical representation of the same is given below.
Downtrend
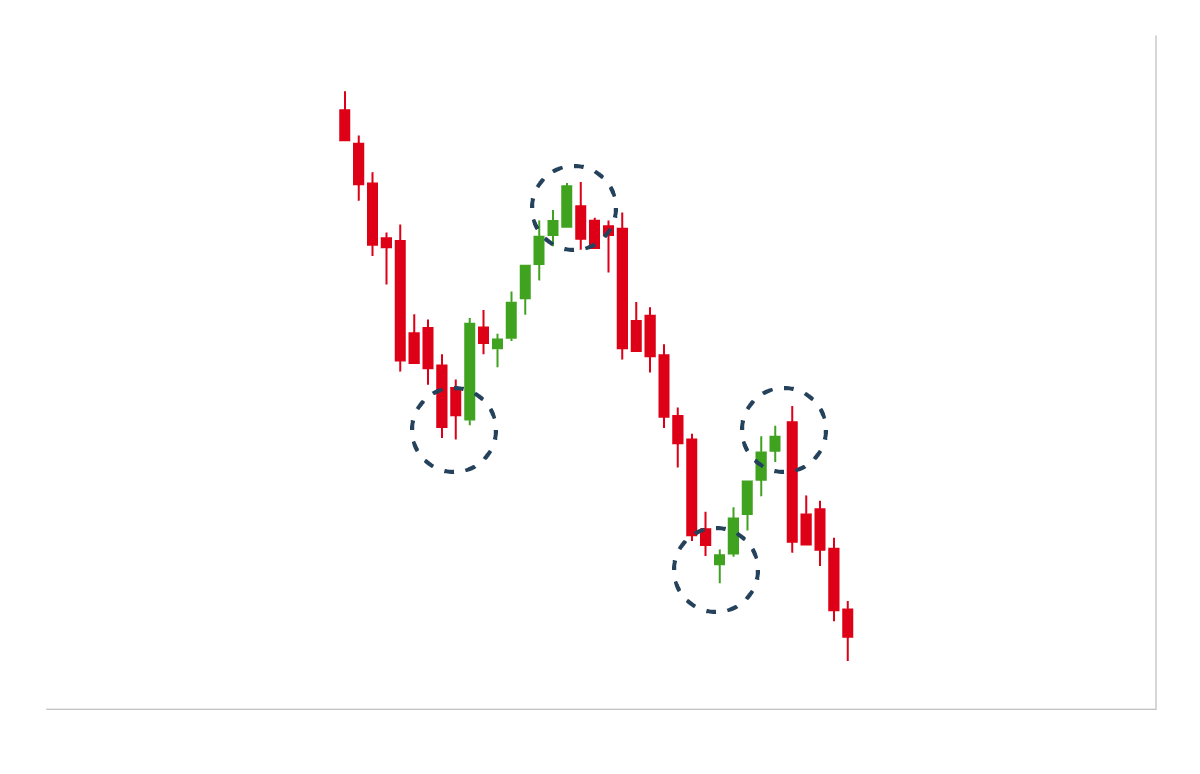
On the other hand, downtrends are highlighted by a decrease in market price value. As assets fall to lower price points, a trader utilizing the trend strategies would enter a short position. Downtrends are considered ‘bearish’ trends which are marked by investor pessimism about the decline in market prices. Lower highs as well as lower lows are a sign of a downtrend. A graphical representation of the same is given below.
Range
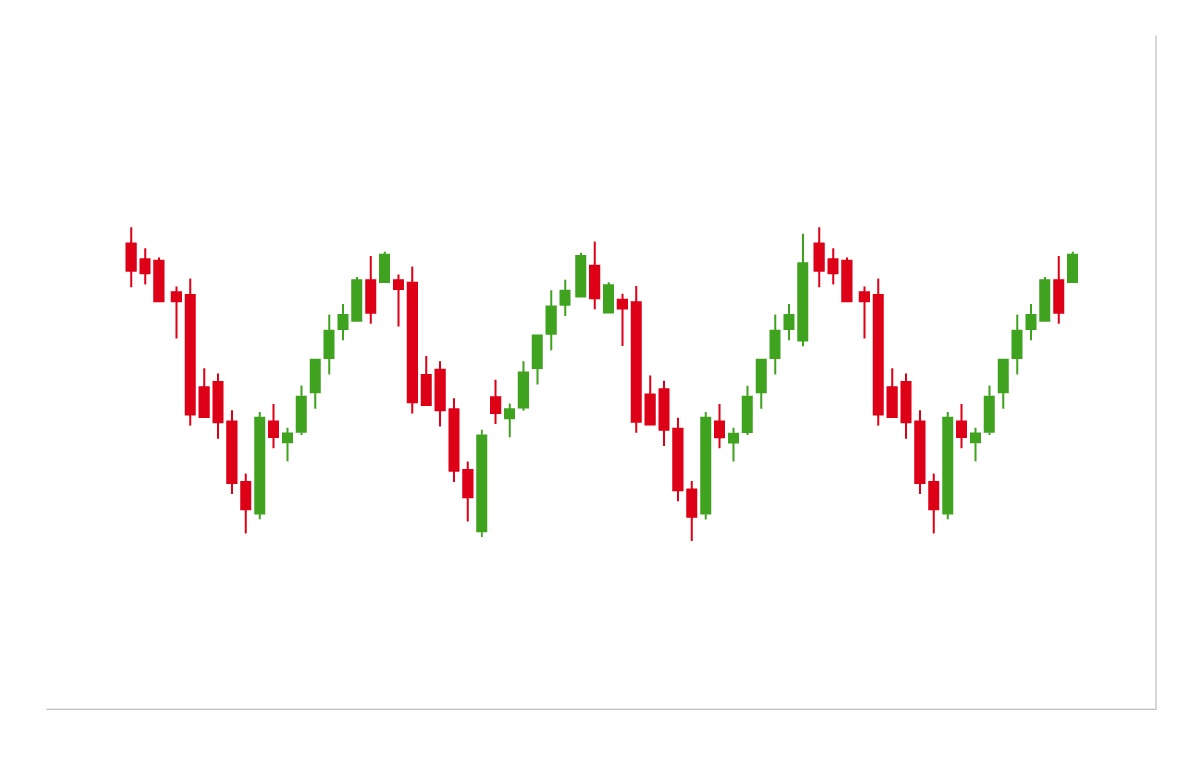
A range or a sideways trend is established when the market price reaches neither higher nor lower price points. Most of the time, trend traders do not take much notice of such trends. However, there are some types of traders, namely scalpers and range traders, who tend to take advantage of short-term market movements and are always on the lookout for such bounded movements. A graphical representation of a sideways trend is given below:
Top Trend Trading Indicators
Over the years, traders have utilized numerous ways to recognize the three primary trends mentioned above. However, the most typical of trend trading strategies that they use include three popular technical indicators. These are as follows:
1. Moving Averages
As a technical analysis tool, a Moving Averages indicator continually updates the average price and thus smoothens out the price data. This is represented as a single line, which allows traders to recognize trends. The popular mid-long term ranges include using moving averages over a 50-day or a 200-day period. While momentum and day traders may use 10-day or 20-day MA. The choice ultimately resides with the individual trader.
Moving averages move much slower than the market price and are thus also termed lagging indicators. What this means is that these basically highlight what has happened previously and are not used to predict future trends. Nevertheless, this is an invaluable tool for traders since its moving average direction helps to confirm how the market is moving, whether up, down, or sideways.
A trader will focus on how the price is moving, whether above or below the single moving average. An uptrend is established if the price moves above the moving average, while a downtrend is reflected by the price dipping below the moving average.
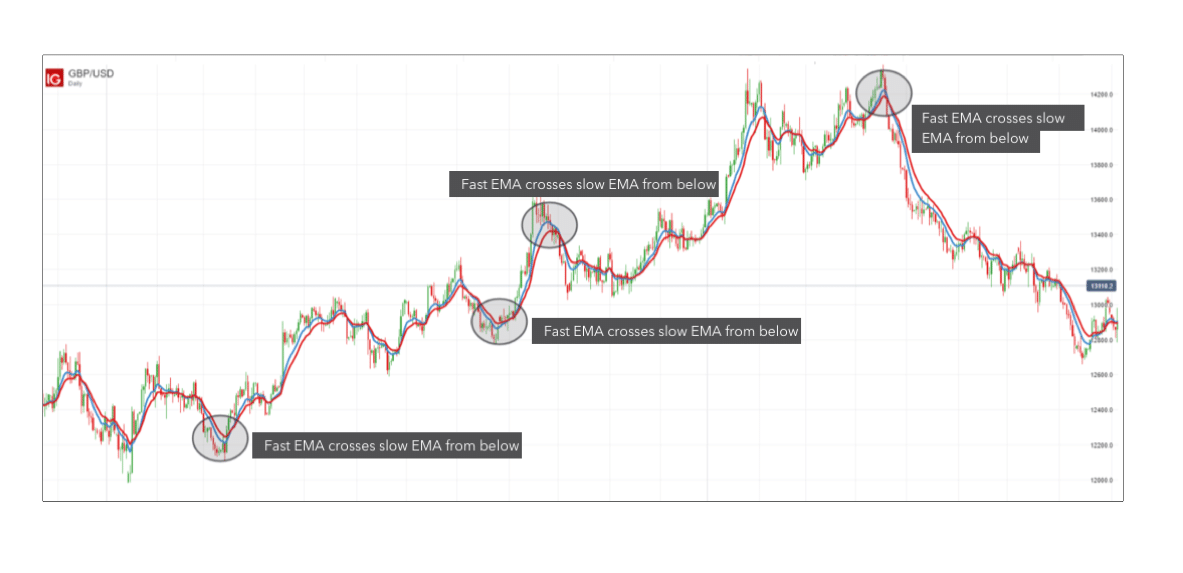
Looking for crossovers between two moving averages is another way of using this indicator. This highlights a change in price direction. These are called exponential moving averages (EMA), with one fast and one slow EMA.
As given in the graph below, when the fast EMA moves above the slow EMA, a trend trader would enter a long position. On the other hand, as the fast EMA moves below the slow EMA, the trader would enter a short position.
2. Relative Strength Index (RSI)
The next trend indicator is the Relative Strength Indicator. This is utilized for the identification of price momentum as well as signals that highlight overbuying and overselling. This is done by looking at the gains and losses on average over a period of time (generally 14 periods) and determining whether price movements are positive or negative.
Relative Strength Index oscillates between 0 and 100. When it is above 70, it is termed ‘overbought’ and when it is below 30, it is called ‘oversold.’
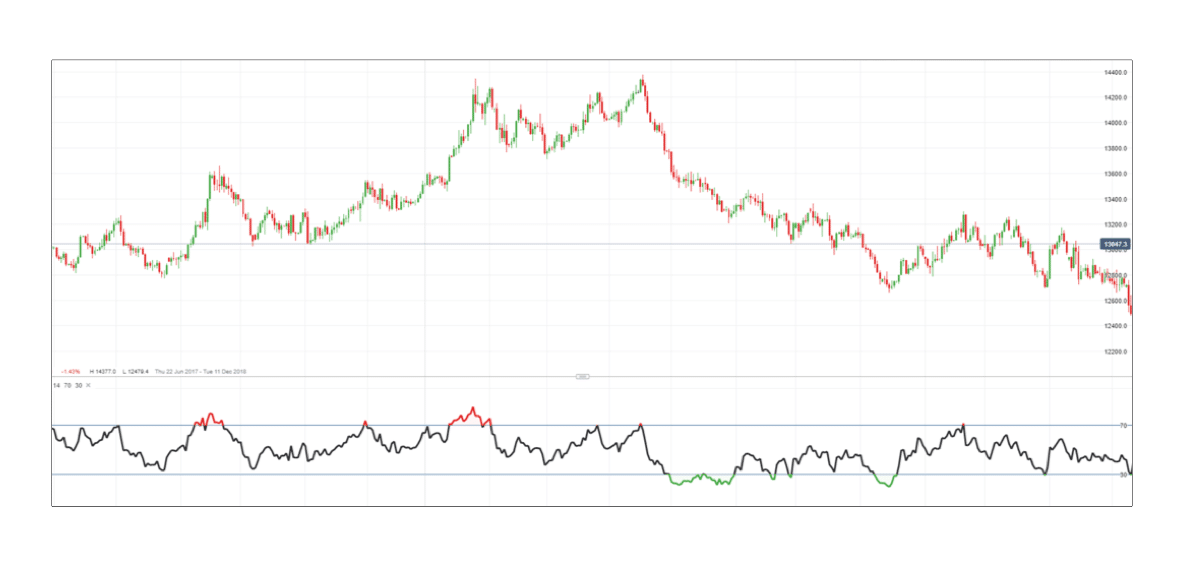
It is important to note that RSI does not highlight the sudden changes in trend since it oscillates only between 0 and 100, while the market price ranges over a bigger set of values. In a long position, traders will utilize overbought signals as the point where they will lock profits and exit trade.
On the other hand, in a short position, traders will utilize overbought signals for an entry point. Those using the oversold signals would do the opposite –use oversold signals for exiting short traders and opening long ones.
3. Average Directional Index (ADX)
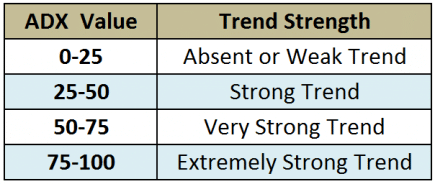
The strength of a trend is indicated by the Average Directional Index (ADX). It too fluctuates from 0 to 100. Values between 25 and 100 highlight a strong trend (the higher the number, the better the strength) and anything below 25 highlights a weak trend.
It is plotted along with the directional movement index (DMI) that comprises positive and negative directional indicators (+DI and -DI). These two lines determine the direction while ADX determines the trend strength.
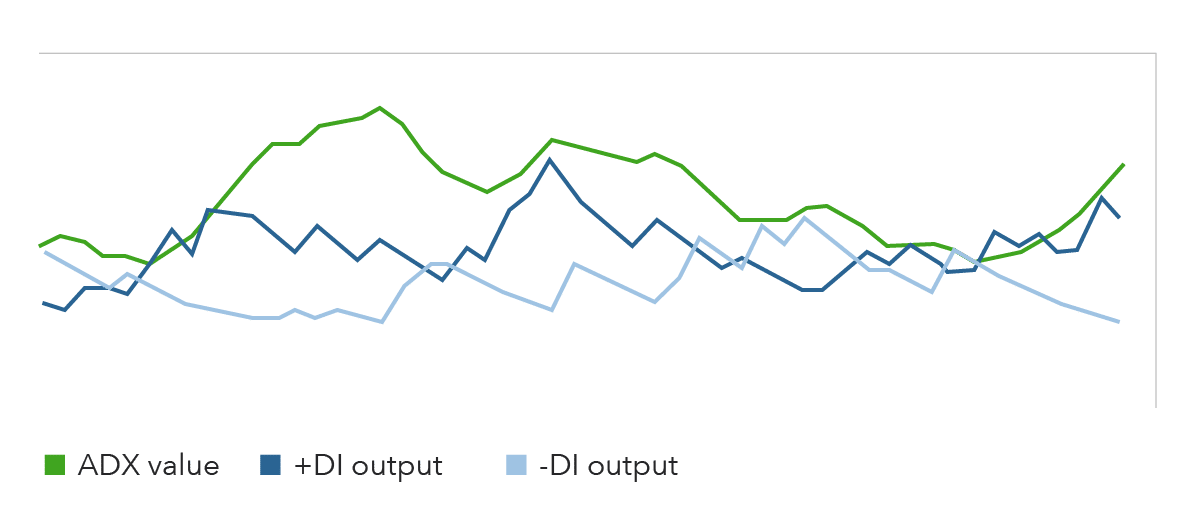
Traders would consider entering a long position when ADX is more than 25 and +DI goes above –DI, which indicates the emergence of an uptrend. On the other hand, when ADX is above 25 but the -DI goes above +DI, a trader could enter a short position since the signal identifies the emergence of a downtrend.
How to begin with trend trading
There are two main steps that a trader should take before beginning with trend trading. These are as follows:
Choose a Market
It goes without saying that a trader should have an idea regarding what s/he wants to trade before opening a position. Many traders may choose to stick with one particular market, while others would want to diversify their positions over multiple markets, thereby exposing themselves to more trends.
Have a risk management strategy
Traders generally use stops and limits to safeguard their trades. It is advisable to exit positions when you are at a favorable market price as this allows one to lock in profits. Trend reversals can occur at any time, which is why it is important to have risk management strategies in place.
The Bottom Line
Price information can be significantly simplified through trend indicators. They not only provide signals for trend trading but also warnings about reversals. These indicators can be used with different time frames and traders can even combine multiple indicator strategies in order to clearly establish entry and exit criteria for trades.