What are Fibonacci Retracements?
There are many concepts in trading. Depending on the beliefs you have, you would use one or another. The Fibonacci Retracement Indicator will be particularly interesting for those traders, who believe there is some order in the Universe, which is projected on the behavior of the financial markets.
In general, Fibonacci Retracement is based on the specific sequence of numbers and their relationships.
For example:
0, 1, 1, 2, 3, 5, 8, 13, 21, 34, 55, 89, 144…
It is the sequence of Fibonacci. Every subsequent number is a sum of two preceding numbers.
To find Fibonacci Retracement, we need to calculate the ratio of the numbers starting from 34 to the next higher figure.
If we divide 34 by 55, we’ll get 0.618. If then we keep finding ratios between 34 and the next alternate numbers, we’ll get more of Fibonacci sequence values. For instance:
34/55=0.618
34/89=0.382
34/144=0.236
We just calculated Fibonacci Retracement Levels.
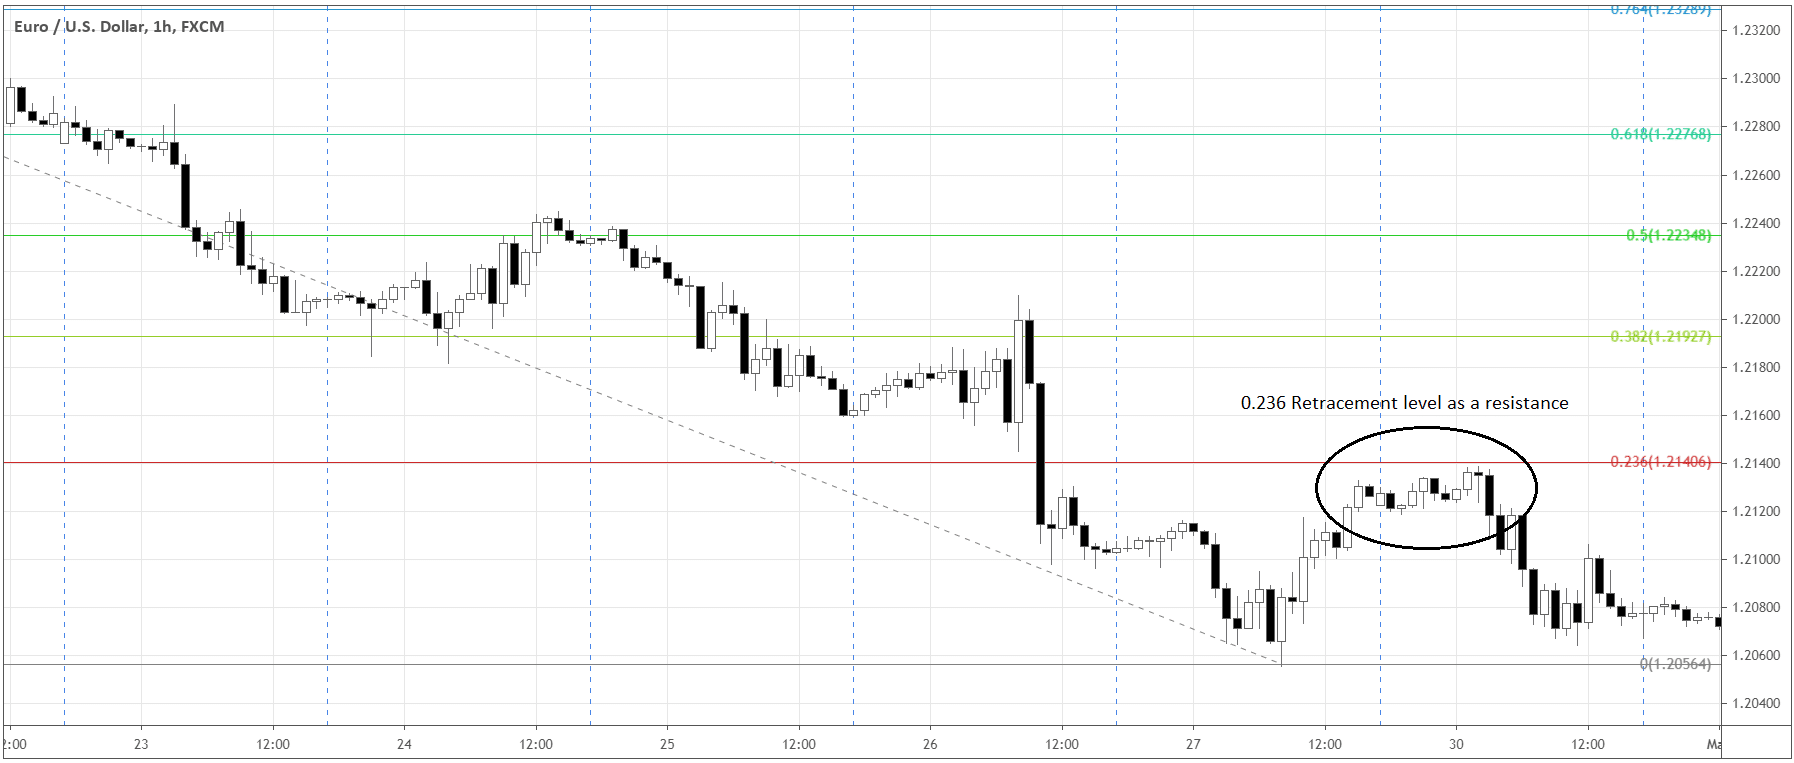
Traders use Fibonacci Retracements to find possible support or resistance levels in trends (see the example below).
Does it work? Looking back at history.
Burton Malkiel, an economist at Princeton, haven’t found a reliable way to predict financial markets using the methods of technical analysis. The economist was one of the first who studied Fibonacci retracements in the ordinary price volatility. According to Malkiel, the fact that sometimes prices test Fibonacci levels is a coincidence. He shared his views in his book “A Random Walk Down Wall Street”. The underlying assumption of Malkiel is that prices of assets are random, and it’s impossible to outperform the market consistently.
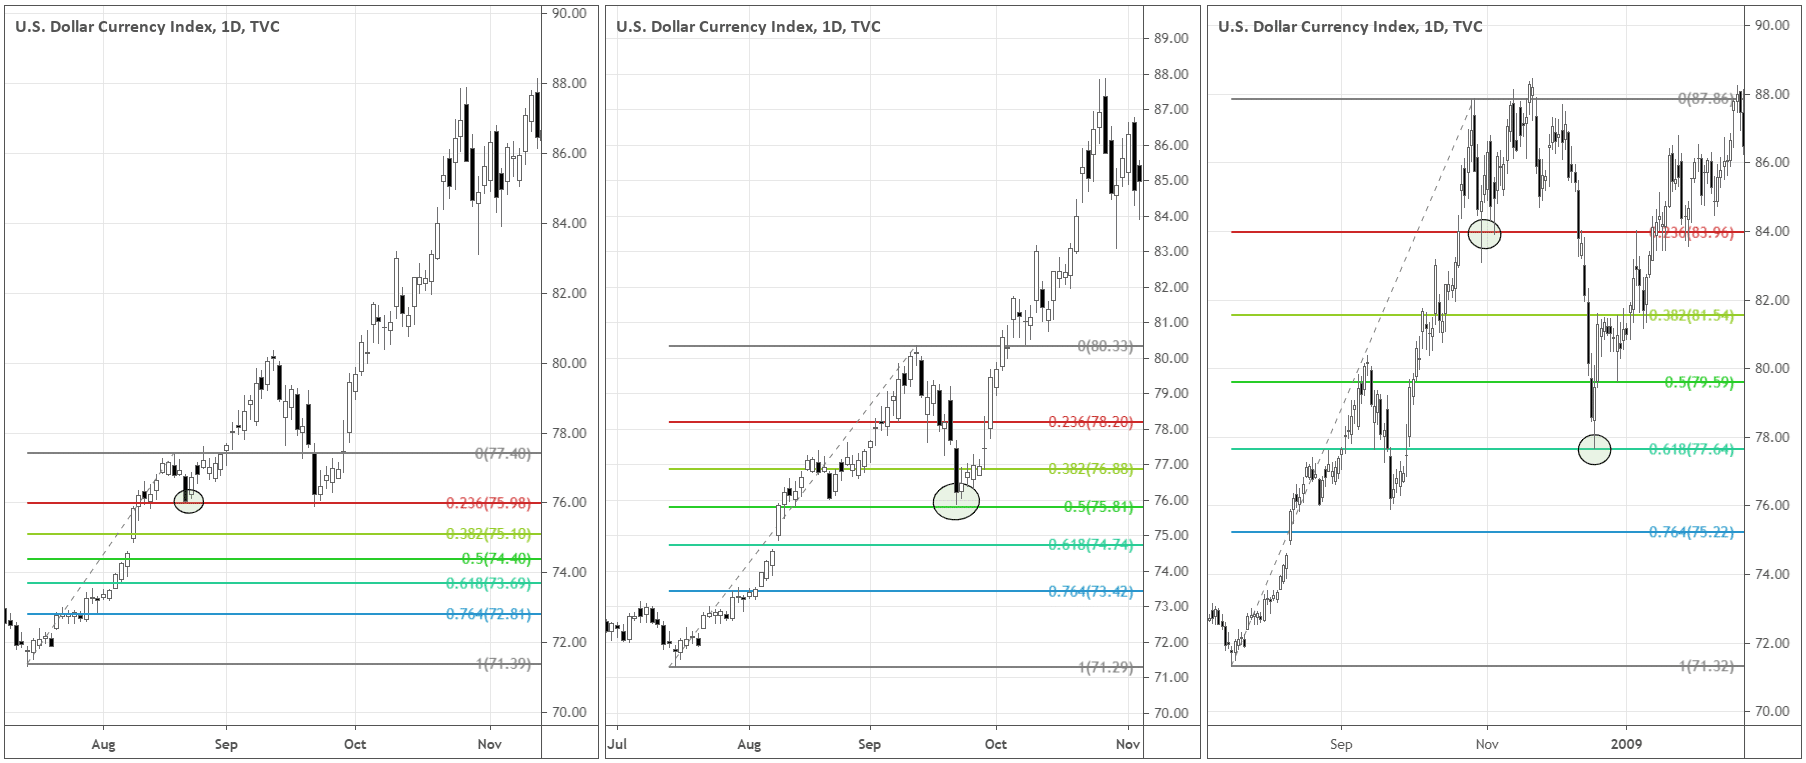
Let’s look at the chart of Dollar Index (DXY) during July-November 2008. Fibonacci Retracements seemingly “magically” predict where the correction moves would reverse back towards the trend.
“Believers” make it work
Any tool of technical analysis tends to work if other traders also believe that it does. While we don’t know who was the first trader that used Fibonacci Retracements and based on what assumptions he/she thought it should work, we know that the tool is prevalent nowadays. Therefore, Fibonacci Levels might work because of self-fulfilling prophecies of traders.
In general, the longer-term timeframes with clear highs and lows of a trend can make more people see the chart in the same way. If the price swings are evident enough, people will similarly apply the Fibonacci Retracements. Longer time frames give more time to the public to analyze the market and come to similar conclusions.
Fibonacci Retracement: why and how?
Many approaches to technical analysis use the concept of Fibonacci Retracements. Gartley patterns, Elliot Wave theory, Tirone levels, and many more employ Fibonacci Retracements in one way or another. That alone should encourage traders – there are many ways to look at the same data. If the methods are anyhow similar, traders are more likely to see Fibonacci Retracements at around the same prices. For that reason, the price action becomes more predictable.
How do we use Fibonacci Retracements in trend analysis? Let’s take an uptrend as an example.
- Identify the beginning of the trend – the absolute low of the initial market move.
- Drag Fibonacci Retracement indicator from the low to the absolute high of an uptrend.
- The indicator will automatically show the prices based on Fibonacci sequence values.
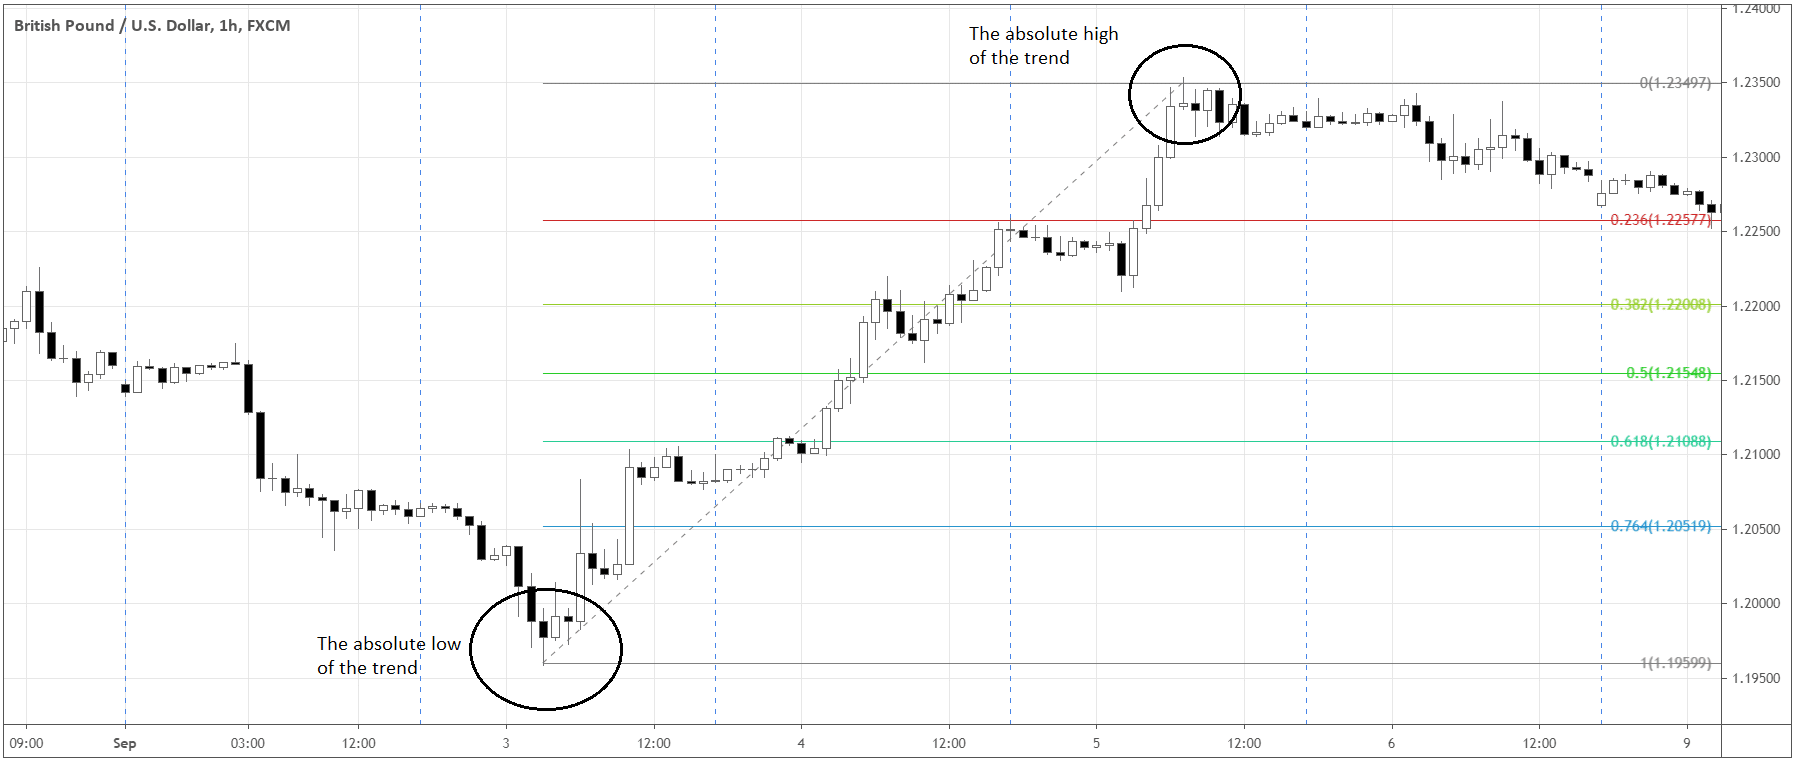
Although 0.500 is not one of the Fibonacci sequence values, it’s still included, as it’s still trendy among traders. For the majority, it’s reasonable to consider a common trend to retrace half of the move before trend continuation.
Eliminate subjectivity – automate it!
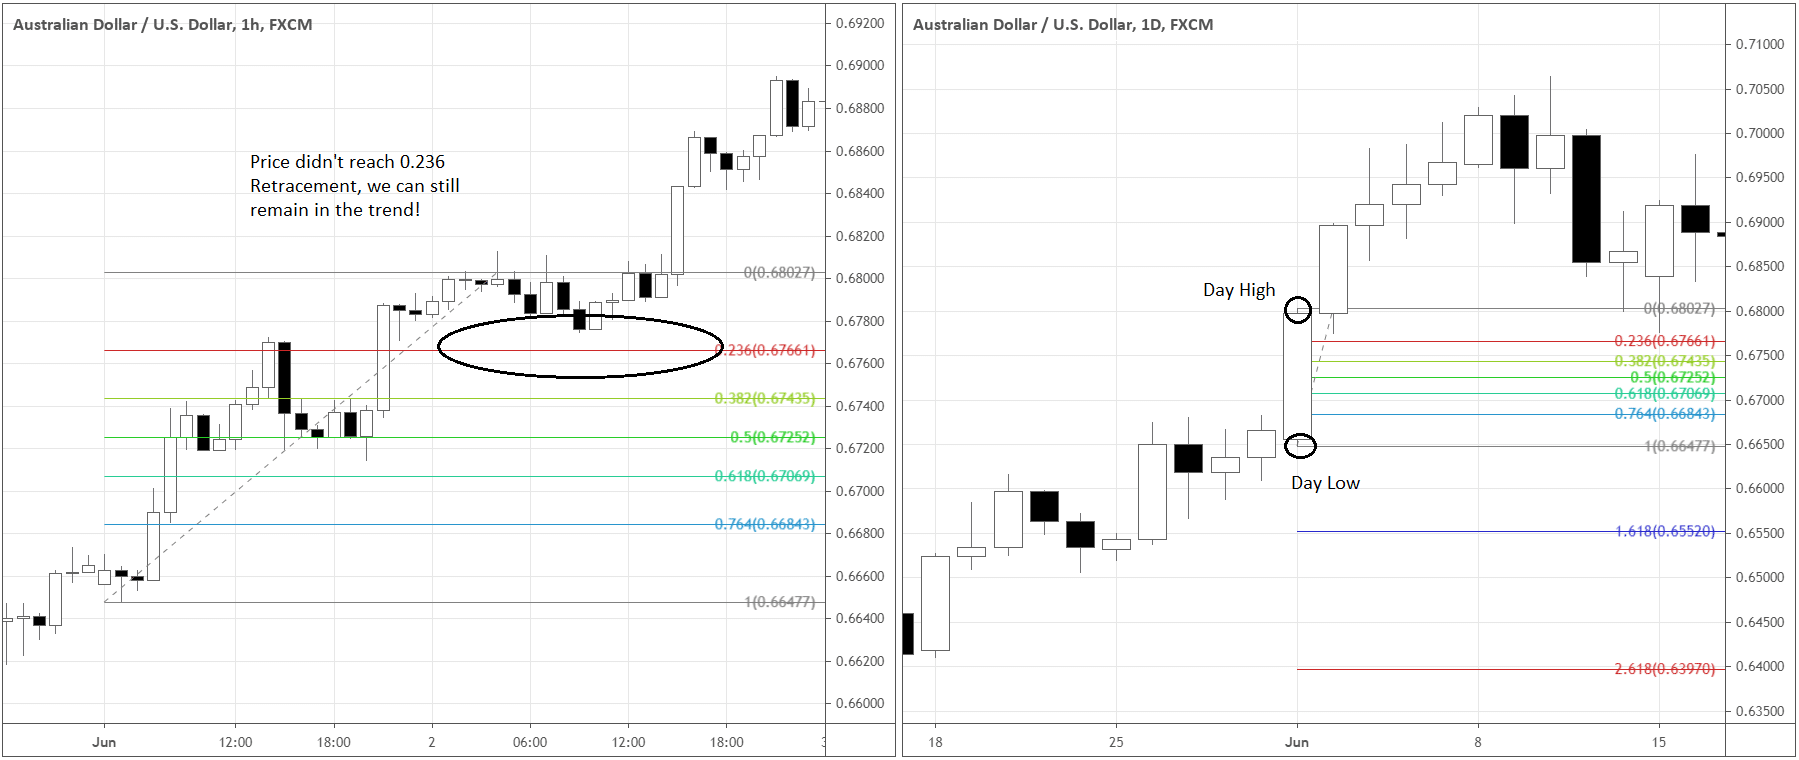
In order to use Fibonacci Retracements in automated systems, the subjective side of the indicator should be reduced. For example, you can use a specific parameter such as “The 0.618 retracement of the previous daily candle”. The actual entry signal can be a “hammer” 1-hour candle with the closing price at a particular percentage deviation from the retracement.
We can also use Fibonacci retracements as exit points. Say, you’re holding a profitable position in a trend, and you want to use automated trailing stops. Trailing stops can be assigned at the Fibonacci Retracement levels of the candle on the higher timeframe.
Let’s look at the chart below. If a system operates on the 1-hour timeframe, the trailing stops script can activate at the close of each daily candle with a big body.
Trading with Fibonacci Retracements
Like any other technical price level, Fibonacci Retracement serves as the infection points. When the price approaches a retracement level, traders can expect several scenarios of the price action.
Let’s look closer at each of them:
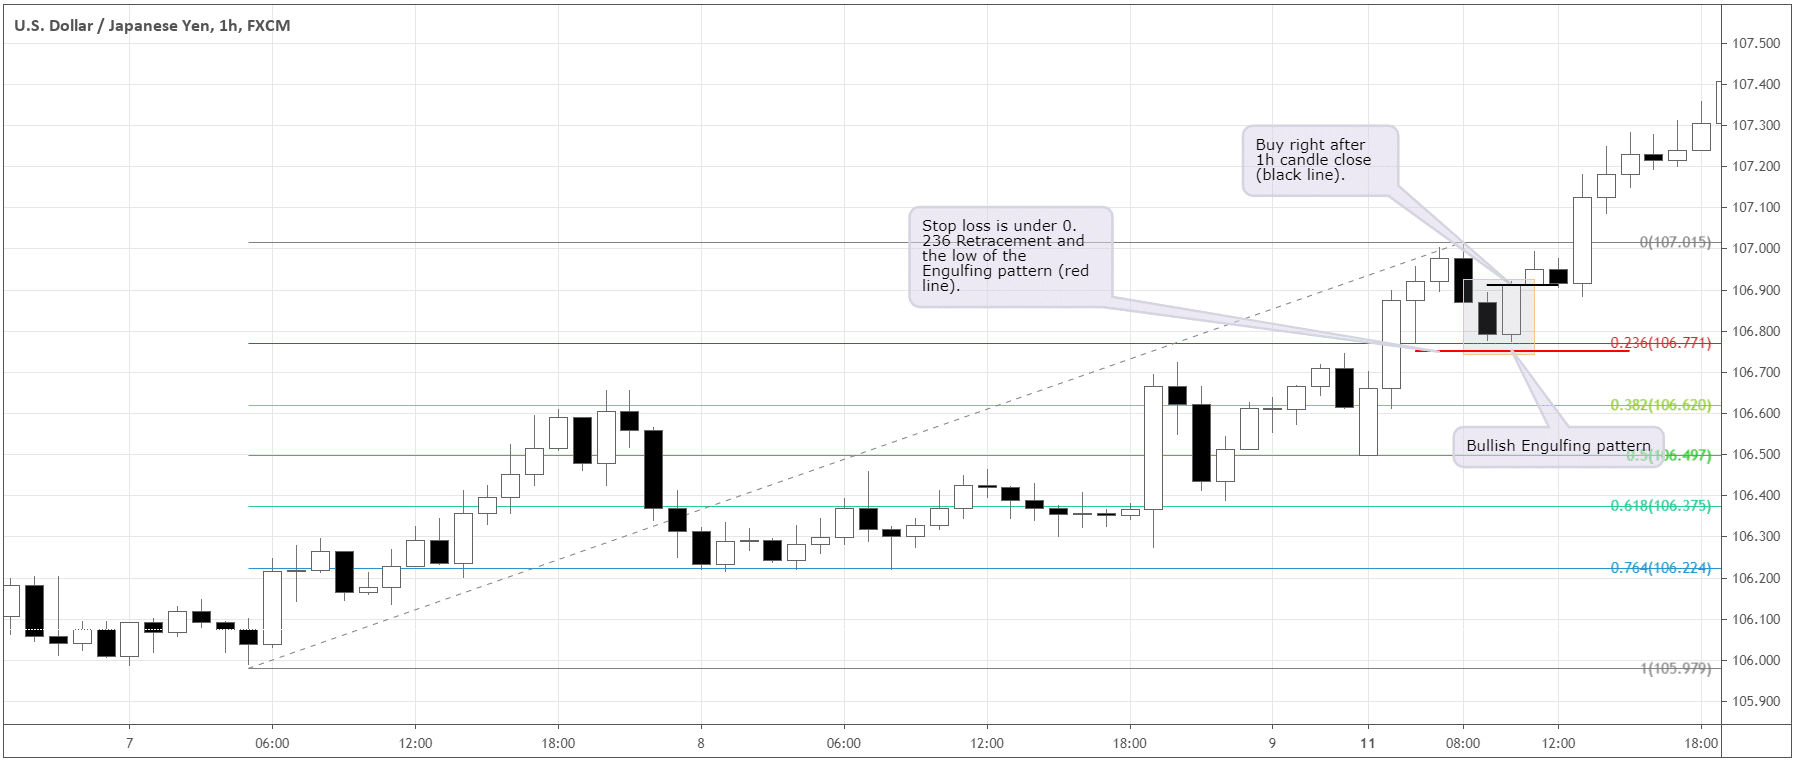
- Rebound – The price approaches a retracement level and rejects it reversing and following a preceding trend direction. Before completely reversing, it would be great to see a price action candlestick pattern such as Engulfing, Doji, Hammer, etc. Such a pattern would give a clear entry signal with a defined exit point. The patterns are formed by traders that want to join the trend at the pullback. It’s always good to be “reactive” in trading and act upon what’s happening in the market rather than rely on a pure predictive approach.
Below you can see an example of the scenario described and how you can place the entries, and the stop-loss.
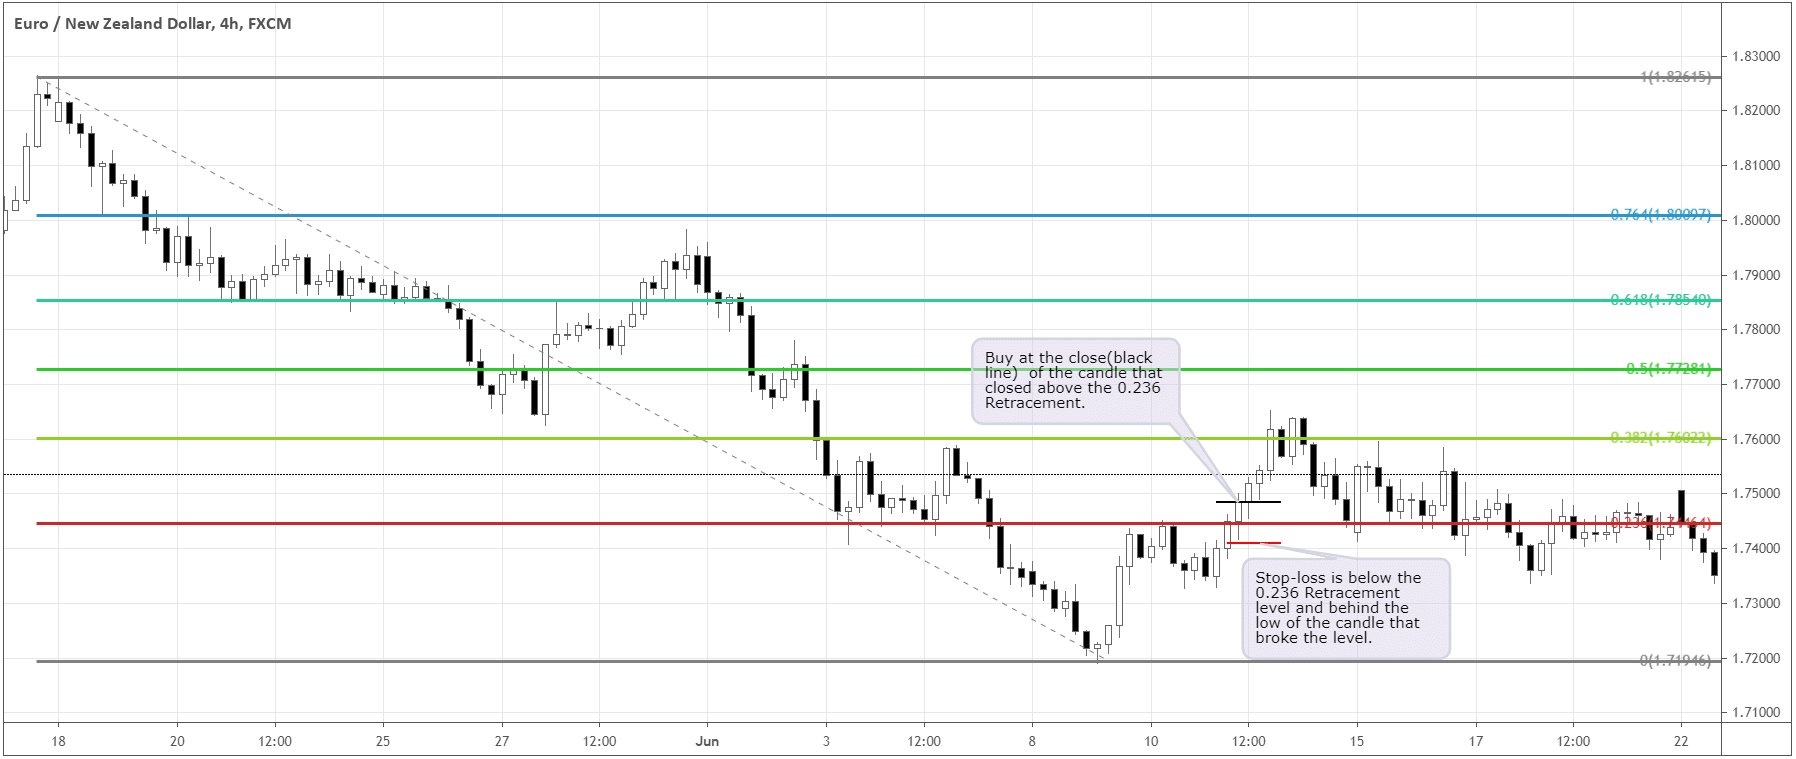
- Breakout – The market gets to a retracement level and, after an impulse piercing the level, accelerates against the primary trend. It happens mainly due to the wrong opinions about the market of the traders, who believed the price would rebound from this level. Anybody trading towards the direction of the preceding trend hopes the trend to continue. As a precaution against the losses, traders may place stop-loss orders behind the expected retracement level. When the level is pushed through, the accumulated stop orders are activated. That leads to the rush to close positions at the best possible prices of many orders at once, which causes strong price movements.
Let’s see how we may trade this kind of setup below.
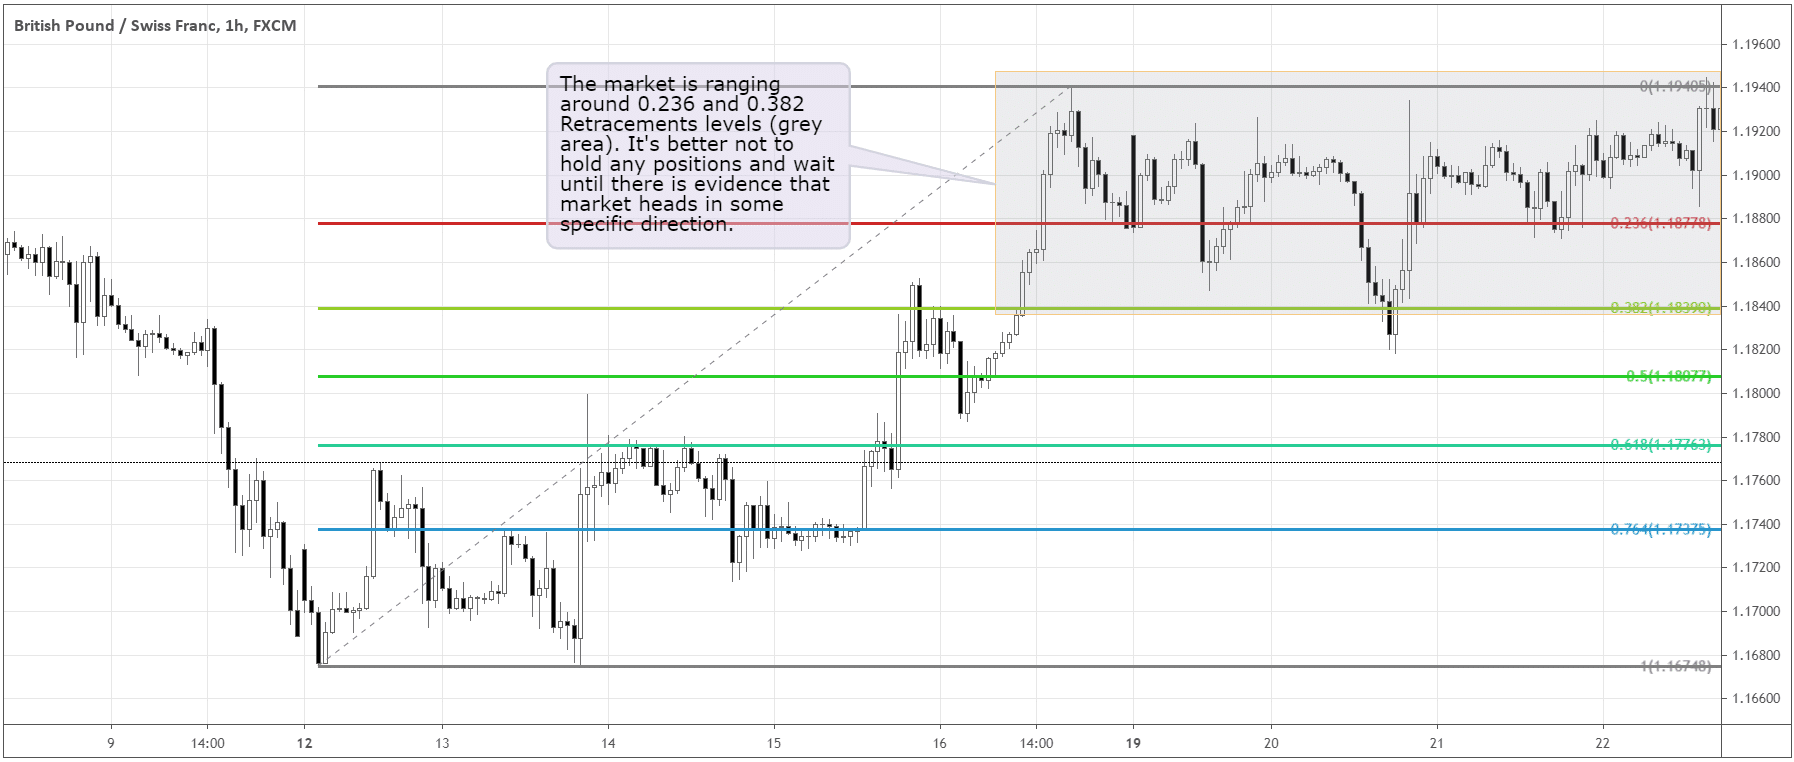
- Range – It generally occurs when two previous scenarios get mixed. Opinions divide equally in a sense whether the market continues the primary trend or it’s time for a reversal. The best tactic here would be to recognize this market state in time and wait on the sidelines (cover your positions) until you get satisfactory signals in either direction.
If you see something like this developing, it’s better to stay flat, until the market presents more certainty in its direction.
Fibonacci can be an excellent supplementary tool to add some odds to your entries or exits. Although the Fibonacci sequence comes from nature, it’s still questionable to what extent it’s reasonable to apply it to the financial markets. The phenomenon of self-fulfilling prophecy makes the tool work with some level of probability. It will be useful to complement Fibonacci Retracements with other tools of technical analysis, such as classic support and resistance, candle patterns, etc. The Retracements can also be used in automated systems as an entry or exit point.
