What is MACD, and what is it made of?
Moving Average Convergence Divergence (MACD) is an indicator that helps to identify a trend direction and the trend’s strength or momentum.
Let’s look at the elements of the MACD indicator:
- Exponential Moving Average (EMA) – is the type of moving average that gives more weighting to the recent price changes. EMA responds to the price action quicker than the Simple Moving Average.
- The MACD line – It’s the difference between 12-period Exponential Moving Average (EMA) and 26-period EMA.
- The “signal line” – It’s calculated as a 9-period EMA of the MACD line.
- The Baseline represents the time when 12-period EMA and 26-period EMA cross, so their difference is zero, and they show the same reading.
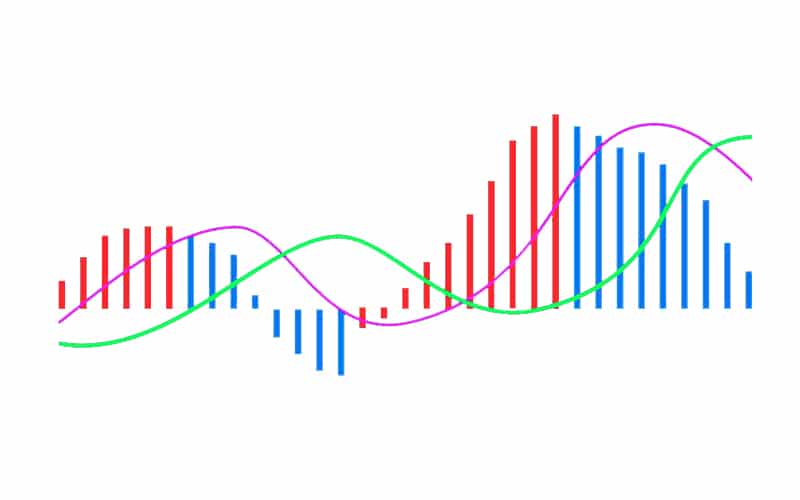
- Histogram – This element of the indicator represents the difference between MACD and its signal line.
There are several interpretations of the MACD signals. The most common ways to get trading signals are crossovers and divergencies.
The story of MACD: Two people – one indicator
Gerald Appel created the widely used MACD indicator in the late 1970s. Gerald Appel has been a fund manager for 35 years before he retired in 2012. He uses a quantitative and strictly systematic approach based on long term price studies in his trading.
Later in 1986, a technical analyst Thomas Aspray found inefficiency in MACD signals, as the signals often would be generated late, especially on weekly charts. He tried changing the periods of the applied moving averages. The change, indeed, helped to produce the signals earlier. The primary purpose was to find the way to speed-up the signals of MACD crossovers, – that’s what made him add the histogram to MACD. The histogram was a better representation of the momentum in the price movement.
MACD crossovers are indicators of important turning points in the price moves of the asset price.
Nowadays, there are different variations of MACD. Other variations attempt to interpret two moving averages, like “Zero lag MACD,” for example.
MACD – how do you want it to be?
To time the market, use the right time!
Like the majority of technical indicators, MACD is more effective on the higher timeframes. The best timeframes to trade with MACD are 4-hour, daily and weekly charts. Although there are fewer signals on the higher timeframes, we can use different timeframes to filter out many low-quality signals. For example, if MACD is bullish on a daily chart, we would only consider buy signals on the 4-hour chart.
Fast or slow? Popular MACD settings.
A trader can use different settings of the indicator. Depending on the traded market and the personal trading style, a MACD can be set MACD to be more or less sensitive to the price action. The standard settings of the indicator are 12, 26, and 9, where 12 is the 12-period EMA, 26 is 26-period EMA, and 9 is a period of the signal line. For those seeking for more sensitivity, other accessible settings are 5, 35, 5. Other popular settings are 19, 39, 9 – the slower one.
The MACD is easy to use as it provides with the straight-forward signals. You can integrate the indicator into most of the short-term strategies as well as automated trading systems.
The problem of comparison
Traders should take into account the “absolute” nature of the readings of the MACD when comparing different instruments. The indicator uses the price value of the instrument to calculate its two moving averages. If the absolute prices of the instruments are too different (for example, USD/JPY and EUR/GBP), there is not much insight the indicator can offer.
Trading with the MACD signals
Let’s look at the most popular trading signals that the MACD can generate.
- Baseline crossover – When MACD crosses the zero line (Baseline), it indicates the change in the direction of the trend, although it doesn’t tell anything about the speed of the change, or the momentum. Suppose MACD moves from the negative territory to the positive, trend changes from the downtrend to the uptrend. What the crossover means is that the fast EMA and the slow EMA are at the same price. You can see the circled crossovers in the chart below.
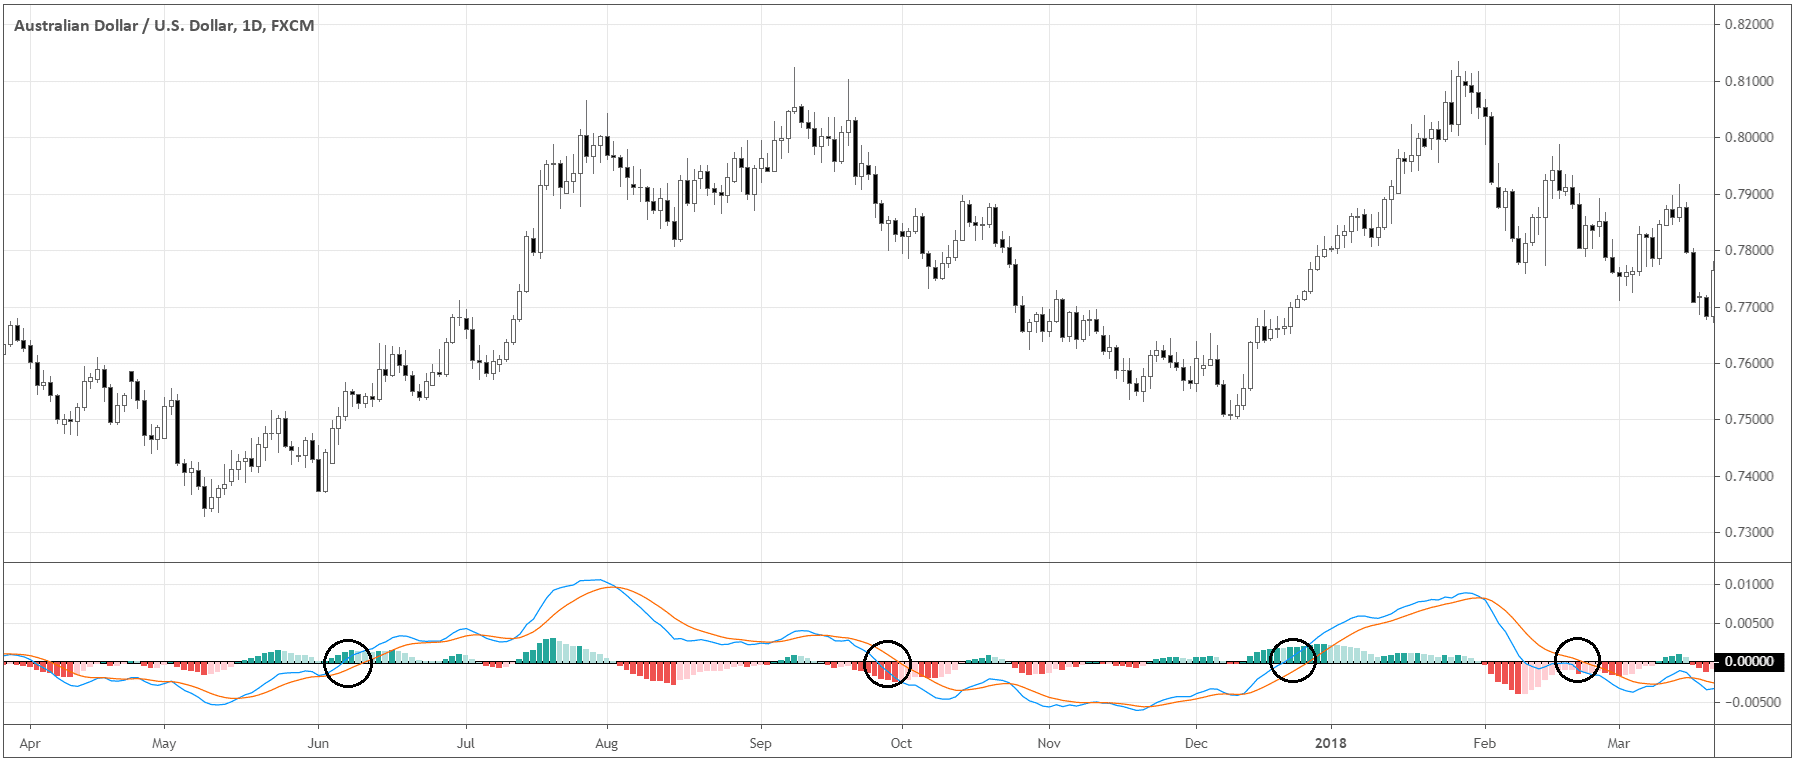
The setup is the most basic one as it attempts to catch the overall trend reversal.
- Signal line crossover – The indicator generates this signal when the MACD line (blue line) crosses the signal line (orange line). A buy signal occurs when the MACD line crosses the signal line from down to up. Conversely, a sell signal occurs when MACD crosses the signal line from up to down.
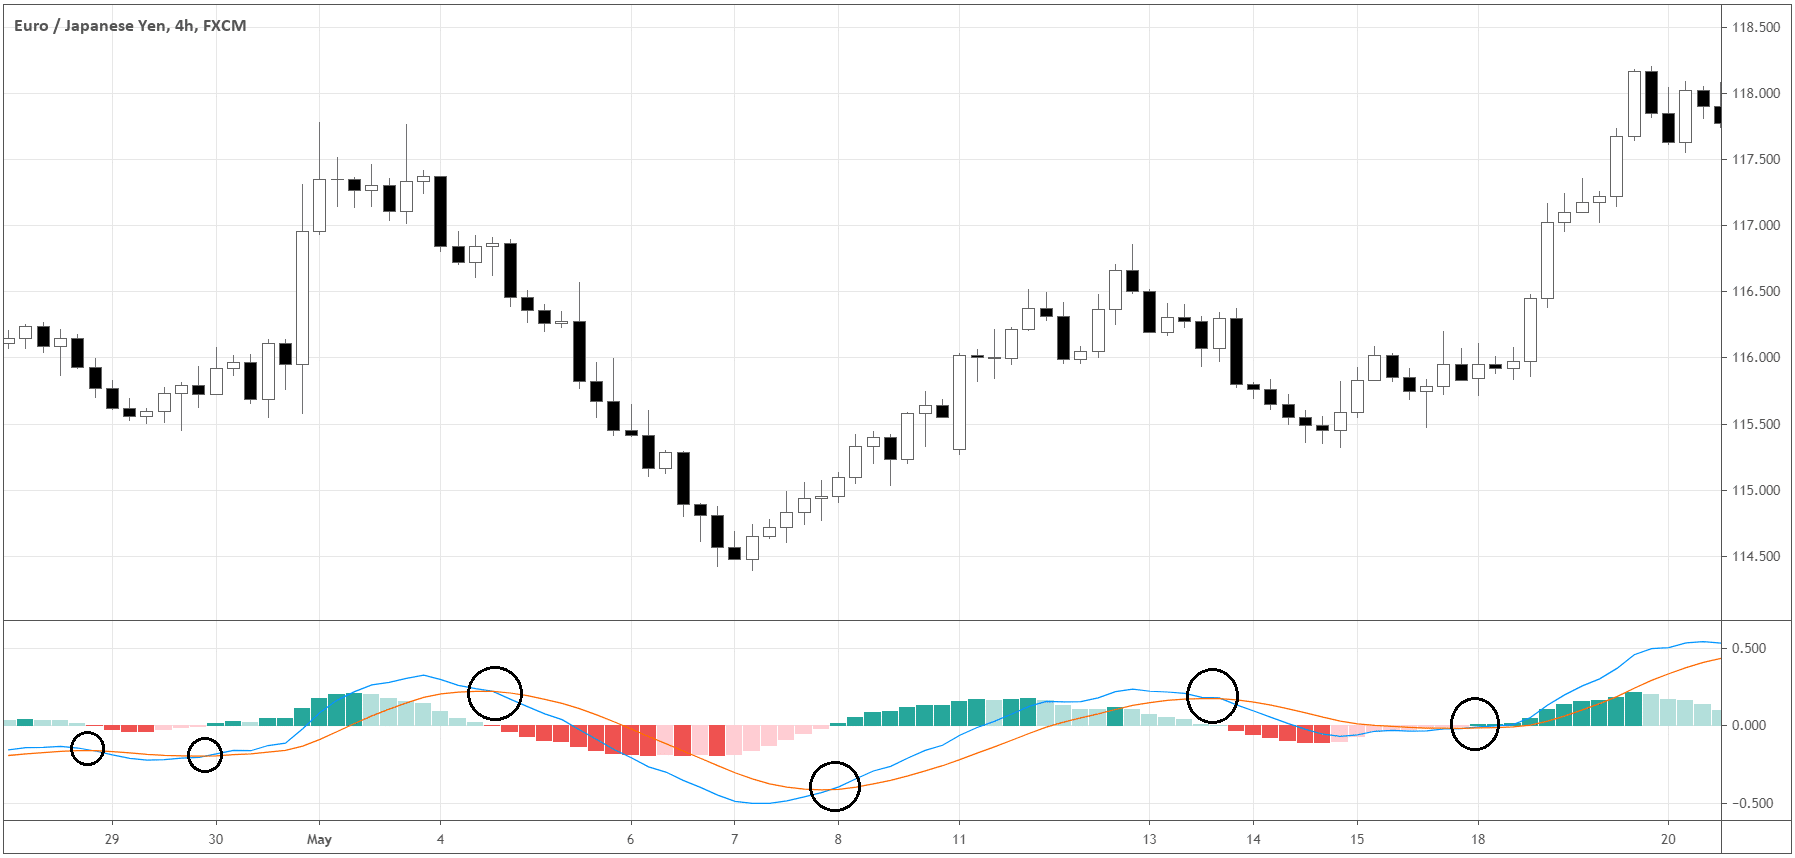
Notice that buys entry appears while MACD is still under the Baseline, so the context of the possible trade is a trend reversal.
If the bullish crossover signal appears above the Baseline, the possible trade will be buying the pullback towards the current trend. This setup has a higher win rate in general.
The idea behind the setup is to take advantage of a fading momentum of the move – either against the trend or towards the trend.
- Divergencies – The bearish signal is generated when the price makes the new highs, but MACD makes lower highs, therefore diverges from the price. Similarly, the bullish signal emerges when the price makes the new lows, but MACD shows higher lows. Let’s see the example of a bearish divergence (marked with the trendlines) in the chart below.
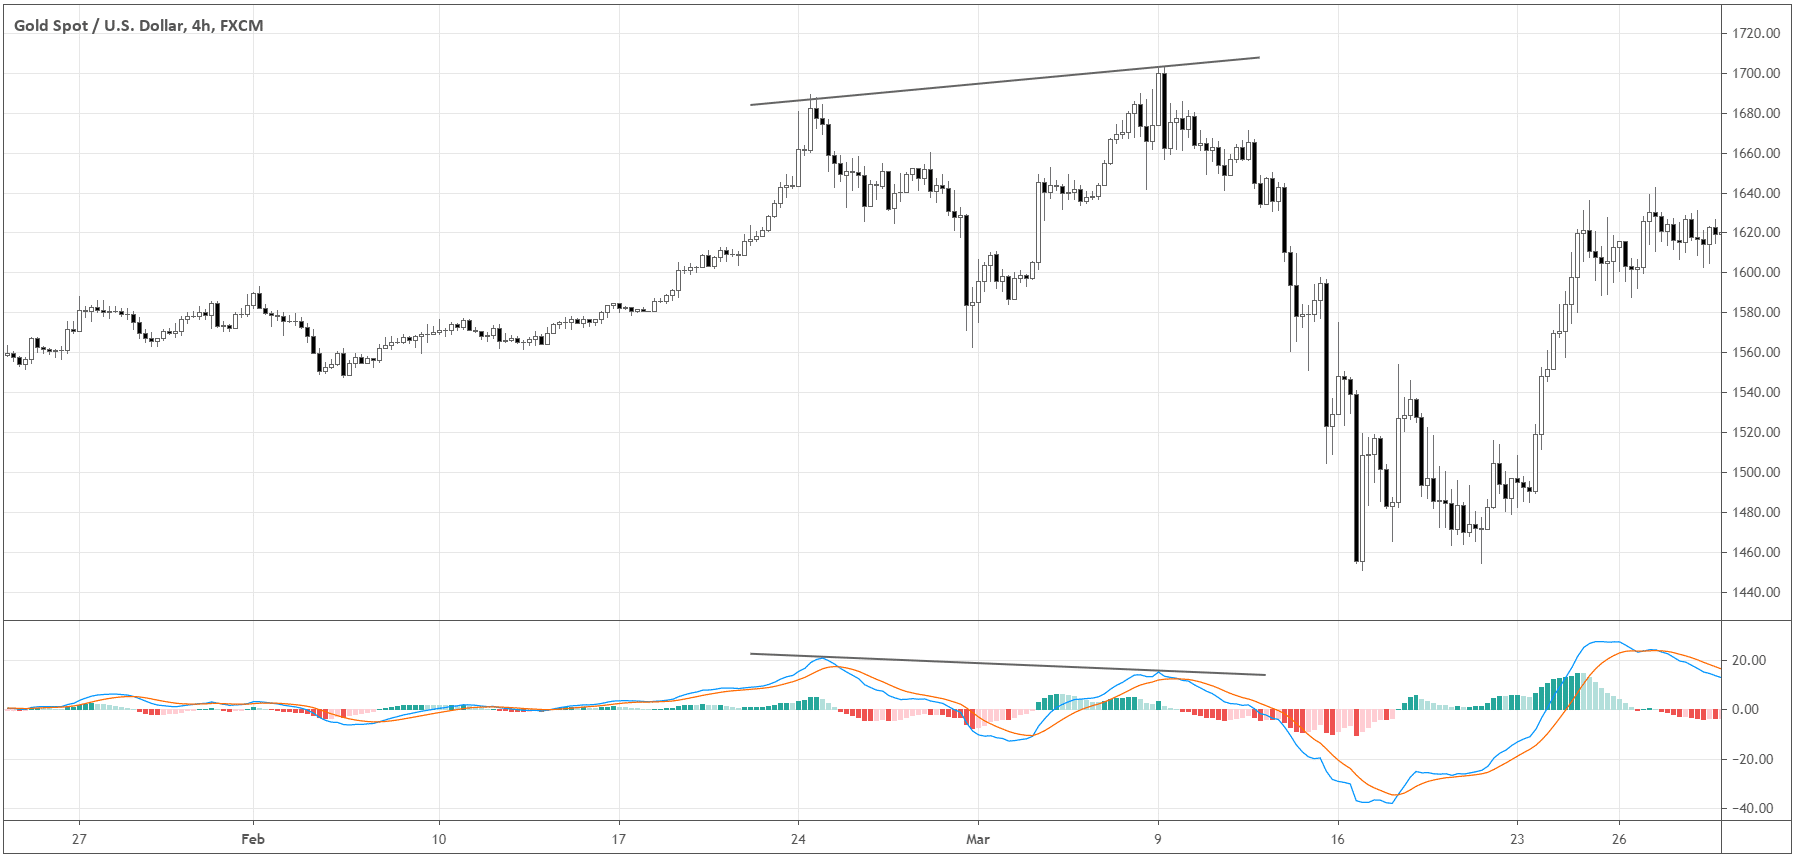
Divergencies hint the fading momentum of the trend. However, they don’t provide us with an exact entry signal. You can be right about the reversal within a medium time horizon but still lose money due to bad entry timing. Other tools of analysis must be employed to determine when actually to open a trade.
MACD, in essence, consists of moving averages; therefore, like most technical indicators, it’s considered a lagging indicator. One of the biggest strengths of the MACD is its multifunctionality. The indicator can identify the change of the direction, momentum, and the divergencies of MACD with the price of an asset. MACD should be used with caution when the price action becomes erratic. During such periods, MACD can generate many low-quality signals that can lead to multiple losses and unimpressive gains. It would be great to employ other tools of market analysis to confirm the signals of the indicator.