Continuation patterns refer to the distinct chart arrangements that happen between an upward or downward rally. When used correctly, these patterns can help you identify key entry levels and avoid being caught up in a reversal. In this article, we will look at some of the best continuation patterns and how you can use them in forex trading.
Bullish flag
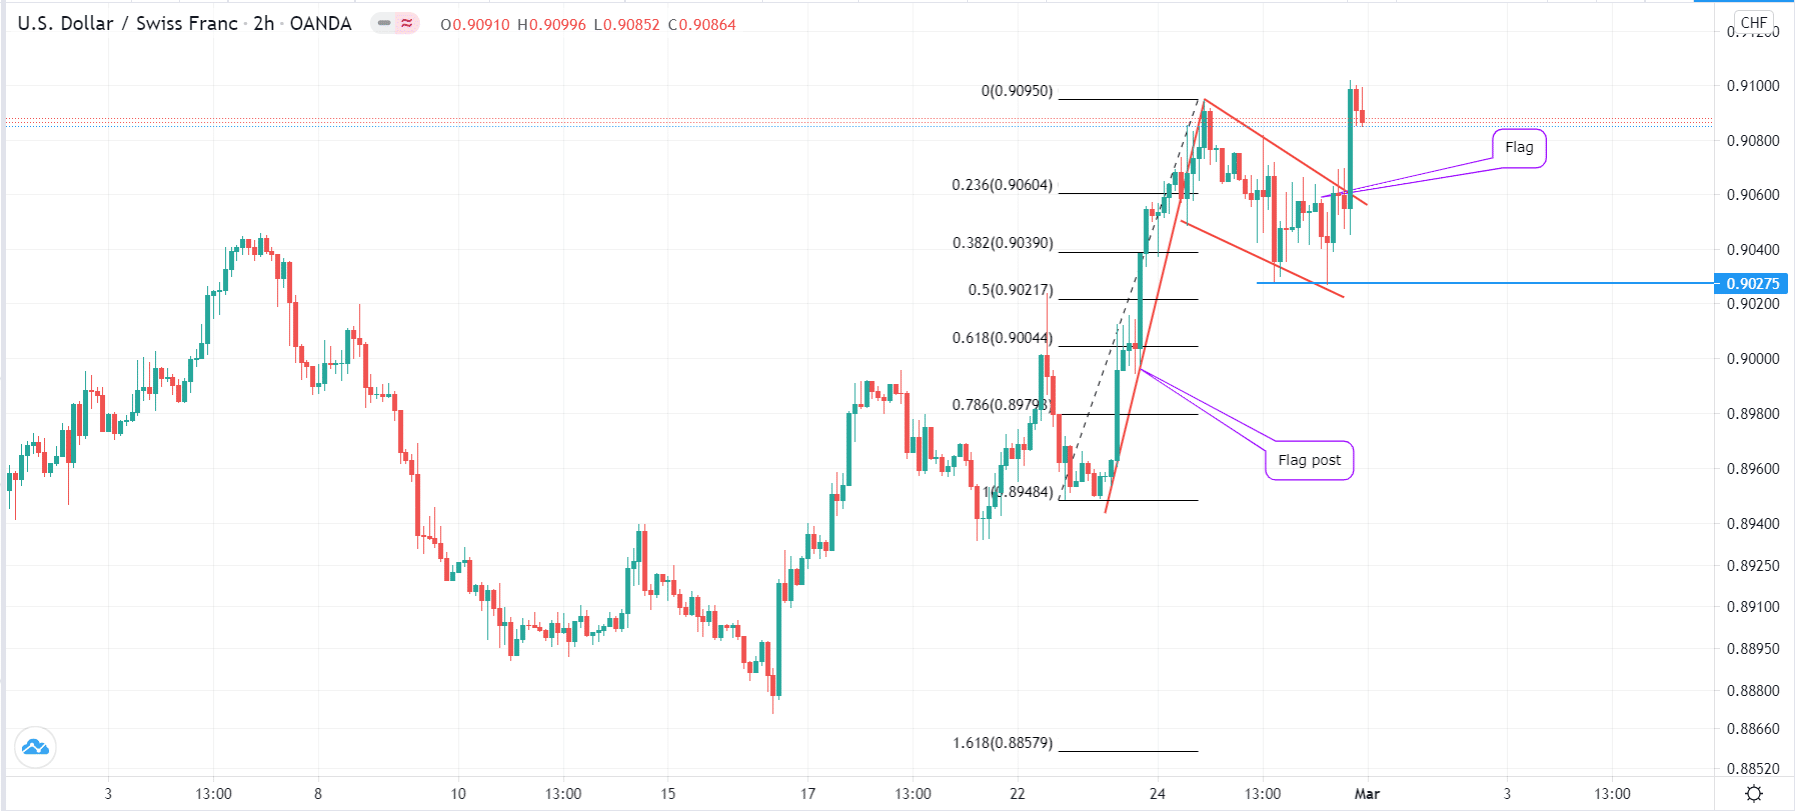
A bullish flag is a pattern that has two key parts. It has a flag post that happens after the price of a currency pair experienced a sharp jump. It also has a flag that looks like a parallel channel. It appears like a real flag.
The idea behind the bullish flag is relatively easy to understand. When a currency pair experiences a major jump, some bulls start exiting, which pulls the price down. For a few sessions, some bulls and bears attempt to figure out the future of the trend. Ultimately, the price tends to break out higher since the original reason for the rally is intact.
A good example of this is in the USD/CHF chart below. As you can see, the price rose sharply, forming the flag post. After this, the price formed a parallel chart with support and resistance levels. Ultimately, the price broke out higher.
Bullish flag example

The difficulty of the bullish flag happens when the continuation pattern fails. While there is no rule in this, a good approach is to use the Fibonacci retracement tool. You do this by connecting using the tool and connecting the lower and upper sides. Ideally, if the price moves below the 50% retracement level, it means that the flag pattern has been invalidated.
The opposite of a bullish flag is known as a bearish flag. It is also a continuation pattern that forms when a currency pair is in a downtrend.
The benefits of using bullish and bearish flag patterns are that they are easy to identify and that they tend to be significantly accurate. Also, these patterns appear regularly, which means that they are useful for both day traders and swing traders.
Cup and handle pattern
A cup and handle is a chart pattern that happens during an uptrend, while an inverse cup and handle forms during a downtrend. It is named so because, when charted, it has a close resemblance to a cup and its handle.
The pattern starts when an asset’s price is in a strong upward trend. After reaching a certain level, it finds a strong resistance, and the price starts a slow downward movement. Ultimately, it forms what is seen as a rounded bottom. The price then starts rising as bulls target the first resistance level.
After retesting the highest point, the price finds another resistance where it either consolidates or pulls back. Shortly afterward, the price will resume the original upward trend.
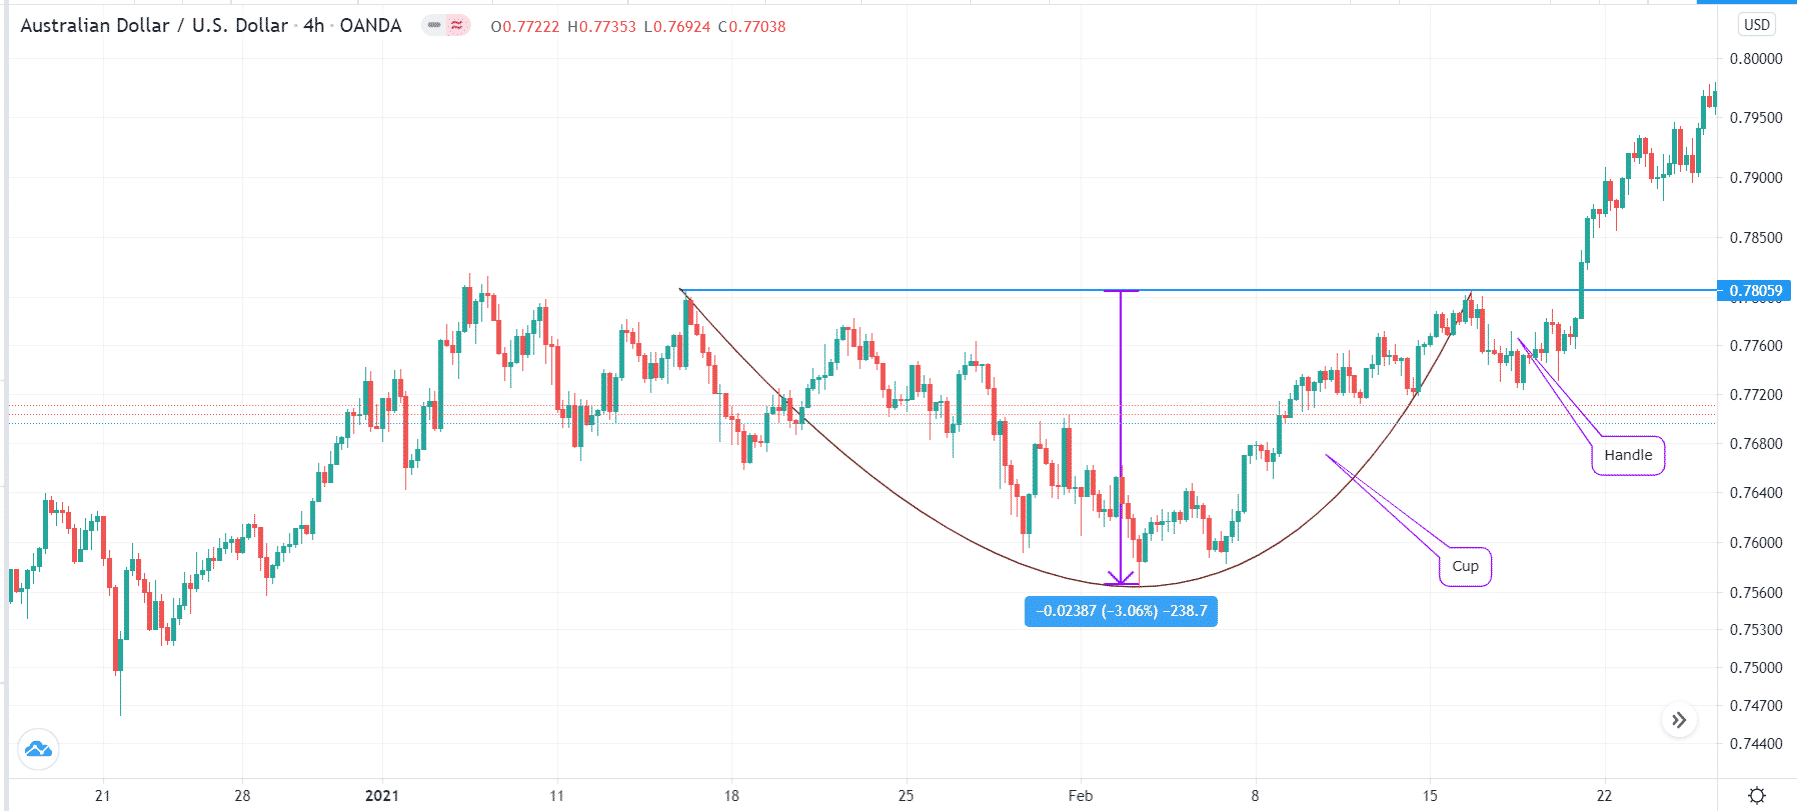
An example of this is in the AUD/USD pair shown below. The chart shows that the pair found a substantial resistance at the 0.7800 level. The pair then formed a cup pattern whose bottom was at 0.7562, which was more than 3% below the resistance.
Next, the pair rose and retested the first resistance level, where it declined slightly to complete the handle part. Ultimately, it broke-out higher.
There are several approaches to identifying the next key level of resistance after a break-out. First, you can identify a psychological level. In this case, since the price’s initial resistance was at 0.7800, you can take the next psychological level to be at 0.7900 or 0.800. Second, you can measure the distance between the first resistance and the lower side of the cup. In certain cases, the price will travel the same distance before finding a major resistance.
Cup and handle example

An inverted cup and handle occurs in the exact opposite way. It starts when the price is in a bearish trend, finds support, forms a rounded bottom, retests the support, consolidates or pulls back, and then breaks out lower.
The benefits of a cup and handle pattern are that it tends to be accurate and easy to identify. The challenge is that it takes a substantial amount of time to complete. It can even take years, making it relatively ineffective to most day traders.
Ascending triangles
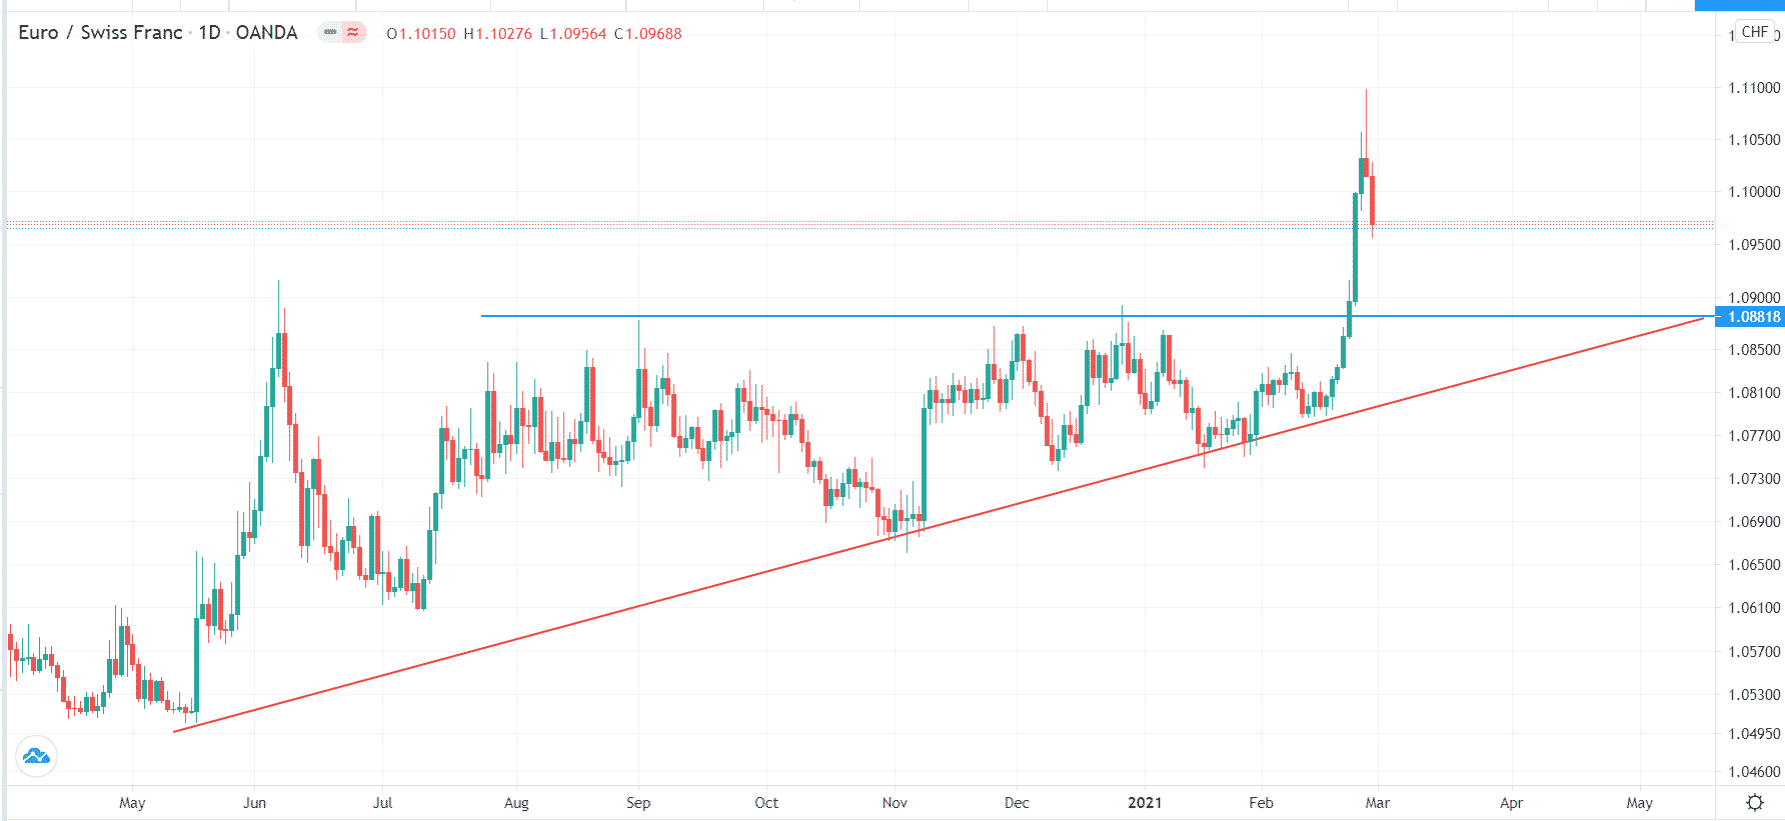
An ascending triangle forms when the price of an asset finds a substantial resistance after a strong rally. After this, there tends to be indecision among market participants about the future of the price. As a result, the price retests the resistance several times and forms an ascending left to the right trendline.
Like the two patterns described above, the idea behind an ascending triangle is easy to understand. After making a strong rally, some bulls will start to exit as they take profit. This will push the price lower, where some buyers will buy the dips. The pattern will then repeat several times. Ultimately, the price will break out higher since the original reason for the uptrend is intact.
A good example of this is in the EUR/CHF chart below. The pair found a substantial resistance at 1.088. After that, it formed several higher lows that are shown in red. Ultimately, the price broke out higher.
Ascending triangle example

The opposite of a rising triangle is a descending one. It forms when the price gains major support that is followed by a series of lower lows. In most cases, the price tends to break out lower.
The main benefits of using an ascending triangle are that it is relatively easy to identify and that it has a high degree of accuracy.
Summary on continuation patterns
There are other popular continuation patterns in the forex market. Some of those that we have not covered here are the bullish and bearish pennants, rounded bottoms, and price channels. Using these patterns can help you identify when a currency pair is about to reverse or when it is about to continue its bullish or bearish trend. You should use the patterns in combination with other tools like the Andrews pitchfork and Fibonacci retracement.
