Buying and selling of cryptocurrencies in the market comes down to the analysis carried out to determine whether the asset would be worthwhile in the short or long term. While the focus is usually on technical analysis in an attempt to try and predict price, fundamental analysis is also important.
Understanding fundamental analysis
Fundamental analysis is a form of analysis that focuses on related economic and financial factors likely to influence a cryptocurrency price. The approach finds great use among long-term investors as it provides insight into how an asset is expected to perform based on several economic factors.
With this kind of analysis, the focus is usually on the hash rate, stats, and active addresses in the cryptocurrency sector, which determine cryptocurrency adoption. The use rate is crucial to ascertaining its long-term value. In addition, transaction values and fees also provide vital insight into a cryptocurrency’s adoption and use rate.
Network analysis
In technical analysis, traders rely on indicators to understand market conditions and price action. The tools provide insight into market sentiments crucial to determining how price is likely to move in the future. The focus is on the network regarding fundamental analysis in the cryptocurrency sector. Cryptocurrencies derive their value from the network.
The value of any cryptocurrency depends on the number of people using or connected to the network. The more the number of people uses a given network, the more valuable the native tokenis likely to be. Similarly, as the number of people using the network increases, the value of the cryptocurrency is also expected to increase.
Understanding network activity is an important fundamental approach to valuing a cryptocurrency.
Network Value to Transaction Ratio
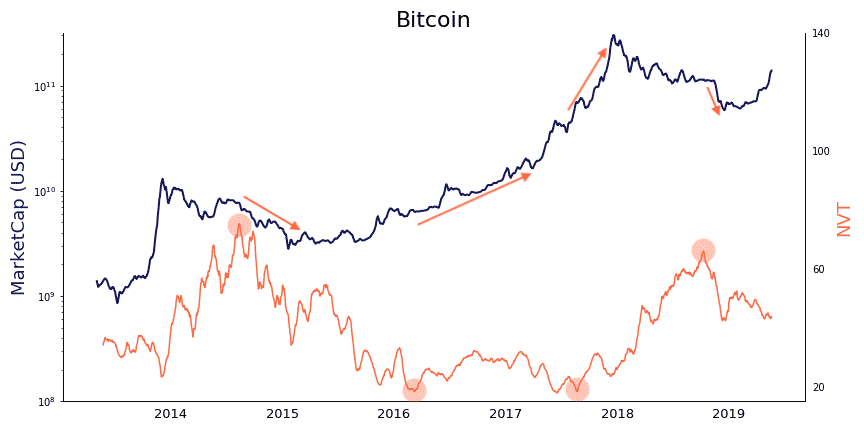
In the stock market, price to earnings multiple provides insights into a company’s share price relative to its earnings. In the cryptocurrency market focus is usually on the network value to transactions ratio. The network value implies the cryptocurrency’s market cap under study, while transactions indicate the number of transactions processed by the blockchain.

The metric provides insights into the relationship between the value of the overall network and how it relates to the total activities in the blockchain. A high network activity value coupled with a low network activity would translate to a high NVT ratio. The reverse is true.

Consequently, a cryptocurrency is considered overvalued when the NVT ratio is too high when compared to the industry standard. It simply means that the token is overvalued relative to its ability to transact. Conversely, traders use this opportunity to enter short positions while trying to profit from a potential bubble burst.
Network Unique Addresses
While trying to ascertain the true value of a cryptocurrency, it is important to pay close watch to the total number of people using its blockchain on any given day. The unique network addresses are one of the best fundamentals on this front.
Unique addresses provide valuable insight into the actual number of people using a given blockchain. Whenever the value of unique addresses is rising, it implies that the network usage is also rising, signaling increased adoption. Therefore, demand for the underlying cryptocurrency is usually high, which causes its value to increase. Similarly, traders use this opportunity to eye long or buy positions.
When the unique addresses are decreasing, it implies network usage is also declining, which translates to reduced demand for the native token. The net effect is usually a decline in the value of the underlying token. Conversely, traders explore entry points to enter short or sell positions.
Network Transaction Value (Daily) indicator
While unique addresses provide valuable insight into the total number of people using a given blockchain or network, the same provides half the picture. It is also important to consider the value being processed in the network in addition to the total number of users.
Whenever the total value of the transaction processed in the network increases, it is highly expected that the underlying cryptocurrency will appreciate. Consequently, traders use this opportunity to look for long positions. On the other hand, whenever the daily value of transactions falls, the value of the cryptocurrency is expected to tank, calling for traders to eye short positions.
The indicator is commonly used to determine the underlying trend of a cryptocurrency.
Mayer Multiple Ratio
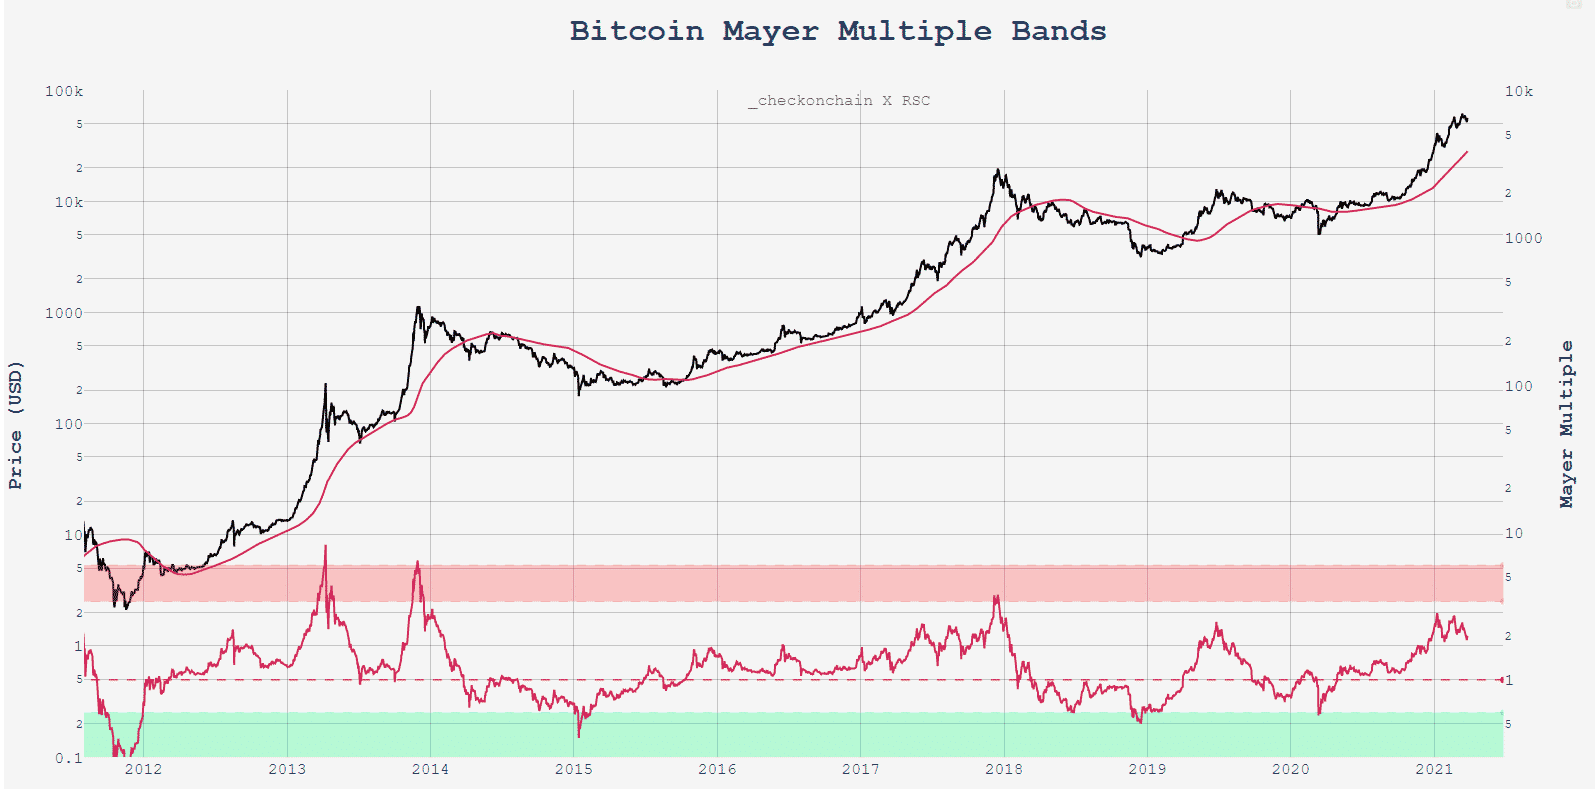
The Mayer Multiple is an oscillator indicator that shows how common a cryptocurrency price is in relation to its historical trading patterns using the 200-day Moving Average.

The metric determines how far away a cryptocurrency is from its average long-term price. Therefore it’s commonly used in confirming overbought and oversold conditions.

Any readings above 2.4 imply a cryptocurrency is overbought. Consequently, it is a warning sign of a potential reversal from the overbought condition. Traders use this opportunity to eye potential levels to enter short positions.
Readings below 0.8, on the other hand, imply oversold conditions signaling that a cryptocurrency has depreciated significantly from its mean level. Fundamental analysis will use this opportunity to enter a long position to take advantage of the discounted price.
Price to Mining Cost Breakeven (P/BE) Ratio
It is important to analyze the costs for cryptocurrencies generated through mining.

When mining costs are higher than the prevailing crypto price, miners are likely to quit as the mining business won’t make any sense on the economic front. Whenever mining activity declines, the rate at which new coins are minted declines leading to a reduction in supply. Low supply amid strong demand in the market tends to cause the overall price to increase.
Likewise, whenever the mining costs are low, more miners are likely to flood the market, leading to the creation of more coins. A high cryptocurrency supply amid low demand tends to influence price negatively; in this case, traders look for short positions.
