In the trading world, price action examines an asset’s history and current performance in order to anticipate how it will perform in the future. To trade price action, you need to keep track of how your commodities, equities, currencies, and indices are performing in order to predict their future trends. You can take a long position if the price activity indicates that the price will appreciate. You can also short an asset if you believe its value will decline in the near future.
As a trader using price action, you need to keep an eye out for patterns and signs that might impact your assets. With this knowledge, you may create your own conclusions and take action on important levels and analyze the risk involved.
How price action trading works
Trading price action entails analyzing the movement of the market in terms of impulse and corrective waves, commonly known as pullbacks. When the trending waves are larger than the corrective waves, a trend is said to be progressing.
For the purpose of determining the direction of a trend, traders look for “swing highs” and “swing lows,” as well as the duration of trending and pullback waves. The price must make higher swing highs and lower swing lows to be considered in an uptrend. The opposite is true when the trend is going in the downward direction. Price charts have support/resistances and trendlines that show the lows and highs of price movement.
Signals from price action
Price action signals, also known as price action patterns or price action triggers, may be easily recognized and utilized to anticipate future market movements. Traders with a lot of experience may often recognize these signals only by looking at past performance and recognizing specific formations.
Trading patterns based on price action
Continuation patterns
Continuation setups are identifiable chart patterns that indicate a time of brief consolidation before resuming the original trend. There is a tendency for prices to go sideways when consolidation takes place. Once there has been a significant breakout from the consolidation zone, the pattern will be completed, and the trend will continue in the same direction as before.
It’s common for price movements to be interrupted for a short period of time by “continuation patterns.” There may be some bulls who opt to take profits and others who wait to see if their buying appetite will triumph, so the price of an asset may stabilize following a strong rally.
To confirm that the trend is resuming, most traders wait for a break above a resistance or below the support and then take a position in the same direction as it.
There are a number of typical continuation patterns, with the most common ones being rectangles, triangles, pennants, wedges, and cup and handle patterns. Uptrends and downtrends can both be predicted on these patterns.

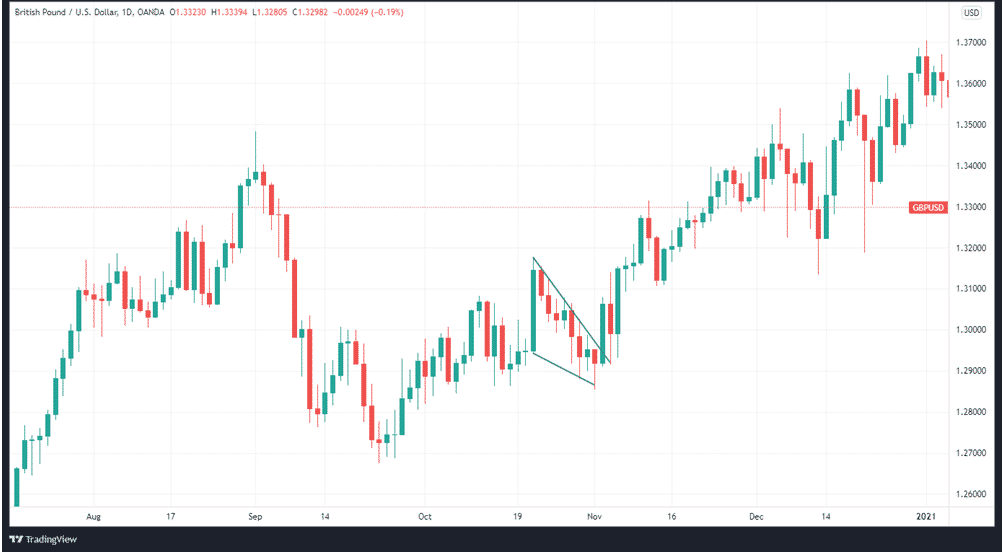
In the image below you can see a wedge and the uptrend of the GBPUSD price that followed it.
Price action and reversals
Price reversals are the result of price behavior that breaks the established rules of uptrends or downtrends. When one of these fundamental criteria is broken, the trend is over. If both criteria are broken, the trend will change depending on the waves being observed.
Consider an uptrend with higher swing highs and lower swing lows. It is a red flag when the new swing low is lower than the previous low. A reversal is in progress if the price follows through by making another lower swing high as well. This does not rule out the possibility of a reversal and a return to an upward trend. A reversal appears to be on the horizon based on the data.

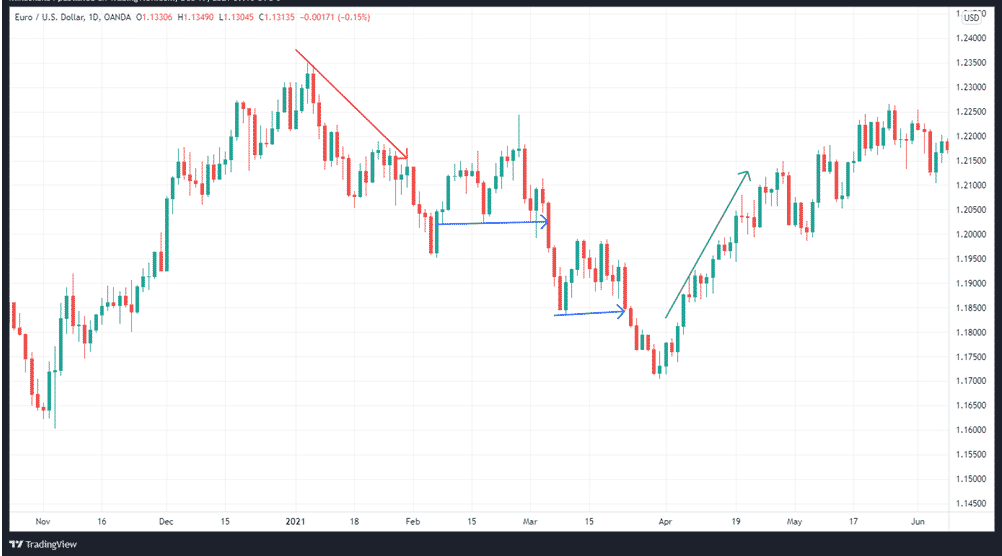
The illustration above shows the downtrend continuation when the lows of the pullbacks are broken.
Entry into the trend after a retracement
Traders that use this method just follow the current trend, which makes it reasonably easy to learn.
A trader may consider going short if the price is clearly declining and lower highs are being repeatedly set. Traders may want to get in on the action if prices are steadily rising and the highs and lows are rising along with them.
Head and shoulders reversal
The head and shoulders pattern, as the name implies, is a market movement that resembles the shape of a person’s head and shoulders. As a result, the price of a pair goes up and down until finally dropping to a lower high before rising again to a new low.
Using a head and shoulders reversal setup, you may take advantage of a short-term price high by entering the market just after the first shoulder and putting a stop loss in place just after the second shoulder.

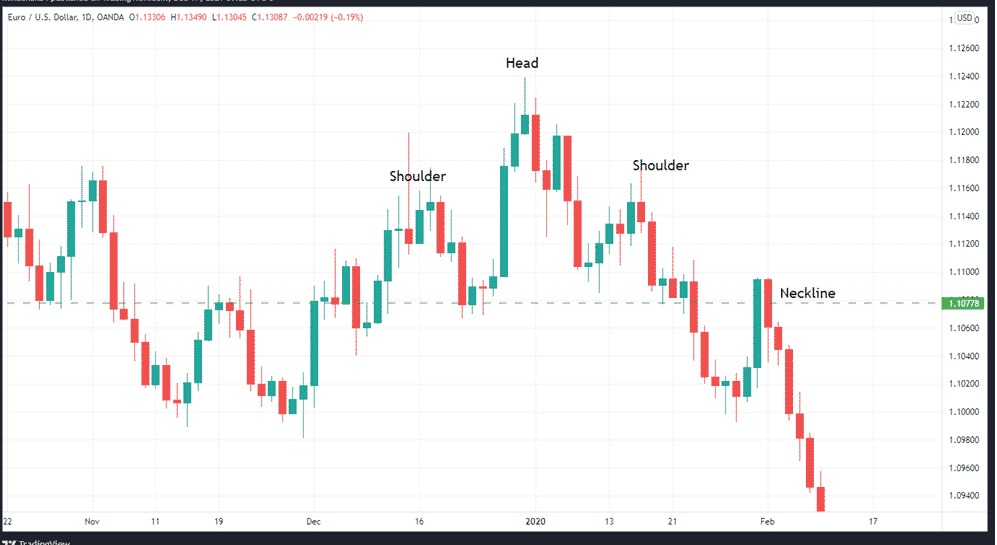
The chart above portrays the H&S formation. Notice how the neckline is retested from below after the breakout.
Candles with a long wick
There are two parts to a candle in the market: a body and a wick (s). The body of the candlestick chart represents the price movement, while the wicks show the price extremes, that is, the highest price and the lowest price in that particular session.
Price action traders like candles with long wicks. For instance, a long upper wick shows that there was a time when buyers tried to drive prices higher, but sellers held them back and even managed to bring them back to the opening price. One can either go back to back with the sellers in the next session or wait for confirmation based on this information. In any case, price action traders should keep an eye on long-wick candlesticks.
Inside bars following a breakout
Inside bars after breakout refers to a candlestick pattern in which the bar between the preceding bar’s range occurs after a breakout occurs. An example of such a candlestick is a hammer. In order to produce this shape, the low is long enough to resemble a hammer handle, while the open, close, and high are all near each other. For traders, a hammer signals an impending reversal of a trend.
A hammer signals the following:
- A seller’s dominance was established as soon as trading began, and prices began to fall.
- Pressure from buyers surged during the peak of the selling cycle and drove the price up.
- There was so much demand that the price closed above the starting price.
- This type of candlestick pattern represents the rejection of lower prices.

Above is the image of a hammer formation. Notice that the wick is over three times longer than the body.
In summary
Price action is a very effective method of identifying and executing high-probability setups in the financial markets. It’s not a guaranteed way to make money, but with enough time and effort, it can become a great way to trade.
