
In the world of technical analysis, chart patterns are the driving force behind many trading decisions. The patterns take the shape of common objects like triangles, rectangles, or even pennants. However, some are extremely complex and thus difficult to spot. The cup and handle pattern is one such pattern.
Understanding the cup and handle pattern
Being a continuation pattern, it mostly occurs when currency pairs are trending. As the name suggests, the setup is characterized by a cup and a handle on the other side. The cup, in this case, occurs as a round bottom formed with prices forming lower lows on one half and tanking to support where a rounded bottom is formed and then bounce back occurs resulting in price moving up and forming higher highs.
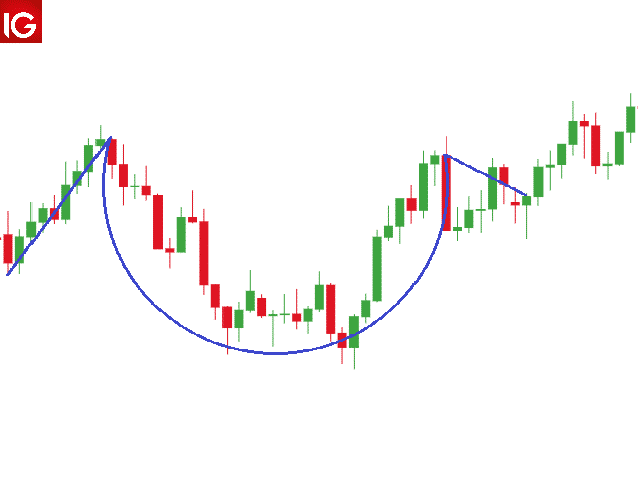
The bounce-back that occurs after the price has bounced off support is usually of great importance as it provides early signs of a buildup in buying pressure. Once the price bounces back and reaches the previous high, consolidation often kicks in. In this case, some bulls exit positions resulting in price edging lower.
The pullback that occurs at the previous high is usually small and short-lived and results in what is often referred to as a handle. The consolidation can be in the form of a descending channel or triangle. A break out from the handle to the upside only goes to affirm the completion of the cup and handle pattern.
How to trade cup and handle
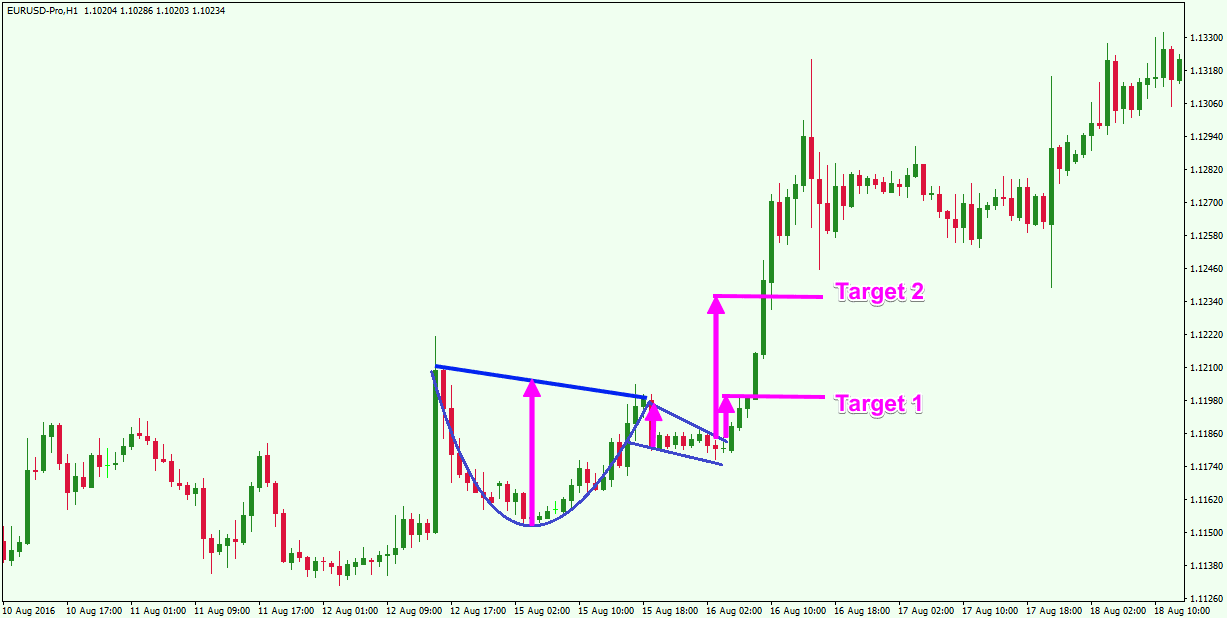
The chart below shows the price trending up in the first half before it hit a strong resistance level and edged lower. The formation of lower lows in the first half only confirms short sellers in control in the near term.
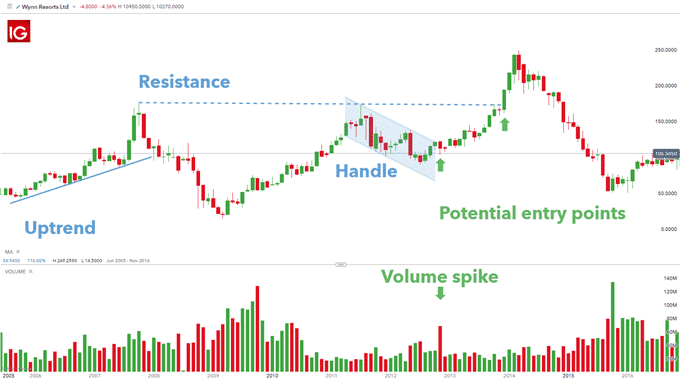
However, once the price hit a critical support level, the volume appears to have ticked up as bulls came back into the fold. The price bounced back and continued to edge higher, only to struggle to edge higher after hitting the previous resistance level. The cup pattern has essentially formed at the resistance level, with traders waiting for the handle to trigger long positions.
The handle, in this case, forms in the shape of a descending channel whereby price falls in a systematic way inside the channel. The fact that the pullback inside the channel is not more than 50% affirms the handle pattern, and those bulls are still in control.
In this case, traders can look to enter buy positions as soon as the price breaks out of the handle pattern at the back of an uptick in volume.
Working example
In the EURUSD chart below, the use of a 100-day moving average provides additional information on the best place to trigger a buy position on the cup and handle pattern.
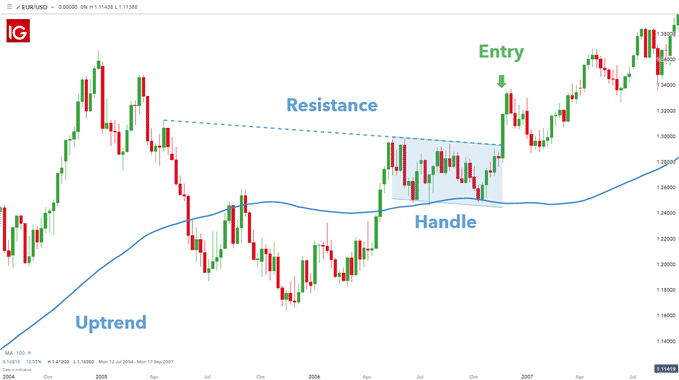
During the formation of the cup, it is clear that the price did tank below the 100-day Moving Average, affirming short sellers in control. However, as soon as the price hit support level, a bounce-back came into play resulting in the price powering high and closing above the Moving Average, affirming that bulls had regained control.
Opening a buy position as soon as the price closed above the Moving Average would be an aggressive play, exposing one to a potential price reversal. Consequently, it is important to wait and see how the price behaves at the resistance level, which coincides with the previous high.
EURUSD got rejected at the resistance level resulting in short-term consolidation that acted as a handle for the pattern. The fact that EURUSD pulled back from the resistance level but held above the 100-day Moving Average acted as an early sign of potential breakout to the upside.
In this case, one could have triggered a buy position above the Moving Average or waited for the price to break and close above the resistance level to try and profit from the cup and handle pattern.
Entry rules
While trading the cup handle pattern, it is important to wait for the handle to form before eyeing potential buy entry levels. The handle should not be too deep, more than 50% of the previous leg higher. To be on the safe side, it is important only to buy once the price closes above the handle, which is the descending channel.
Once the price moves out of the descending channel or triangle, the pattern is considered complete, signaling a continuation of the underlying uptrend. However, it is important to note that while the price is always expected to rise once it breaks out of the handle, that is not always the case. Therefore, it is important to deploy risk management strategies while playing out this pattern.
Setting stop loss
A stop-loss order acts as an ideal risk management play. The order is designed to get one out of the trade should the break out of the handle fail to hold, resulting in a lower price. In this case, one can look to place a stop-loss order slightly below the lowest point of the handle of the cup and handle pattern.
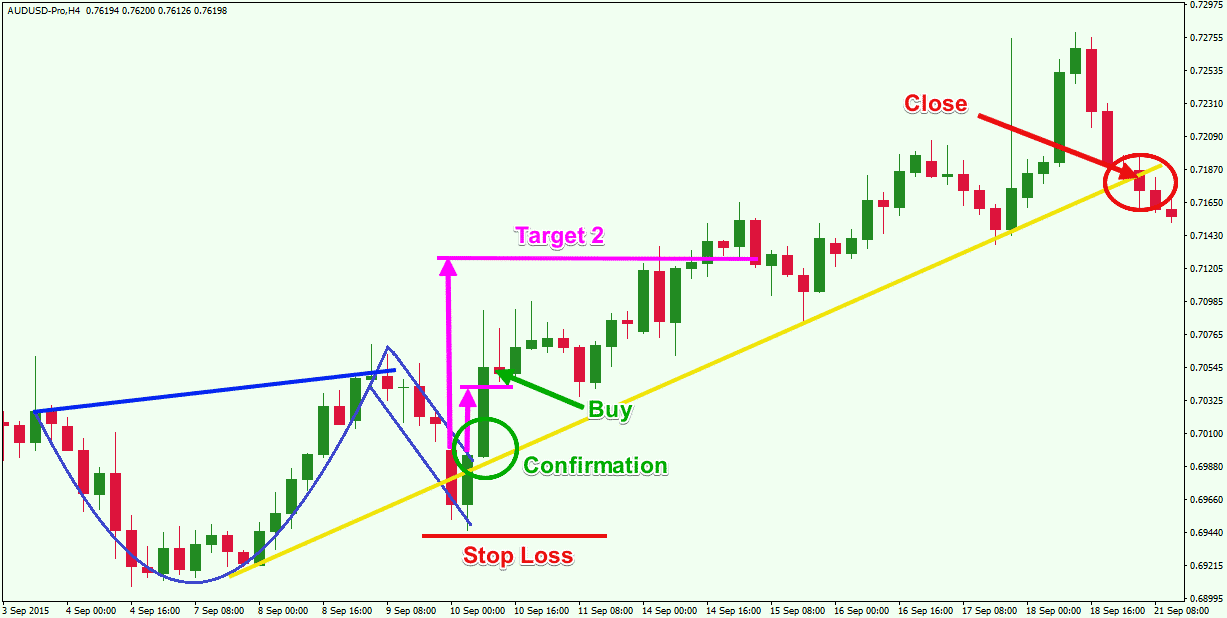
In addition, the stop-loss order could be placed a few pips from the entry point or below the most recent swing low. Additionally, one should never place a stop loss in the lower half of the cup formation.
Placing the stop loss in the upper half of the cup only goes to increases the risk-reward of the trade placed.
Profit target
When it comes to profit targets, one can measure the height of the cup from the bottom to the highest level of the cup and extrapolate it from the entry-level to determine the best place to lock in profits.
Bottom line
Cup and handle is one of the most reliable patterns for experienced traders. The pattern offers a high risk-reward when played out correctly given the well-defined entry, stop, and limit levels. However, the formation can be difficult to identify for novice traders. It also may require the support of other technical indicators.