
You get a lot of benefits when you employ harmonic patterns to create your trading strategy. You can easily find and track these patterns, as well as use them to guide your trading. Technical analysts employ harmonic patterns as a way to analyze price behavior and anticipate future price fluctuations. An investor may be able to generate hypotheses about where and how far an asset’s price may increase or decrease if they evaluate it using harmonic patterns.
Similar to other pattern types, harmonics have the greatest potential for success when trading them as soon as they are established. Making a decision about a potential pattern and trading before it is established is one of the most commonly made mistakes. Using harmonics is tough, but the insights into future price fluctuations that they provide are invaluable.
The golden rule of harmonic patterns
Harmonic patterns differ from the typical chart-trading type because the patterns are only considered tradable if it meets a number of specified movement criteria. It will help trade move away from relying on luck, and will instead provide traders the ability to approach trades with a more methodological approach. Harmonics require the understanding of Fibonacci retracements and extensions because the movement in the market is controlled by them.
Types of harmonic patterns
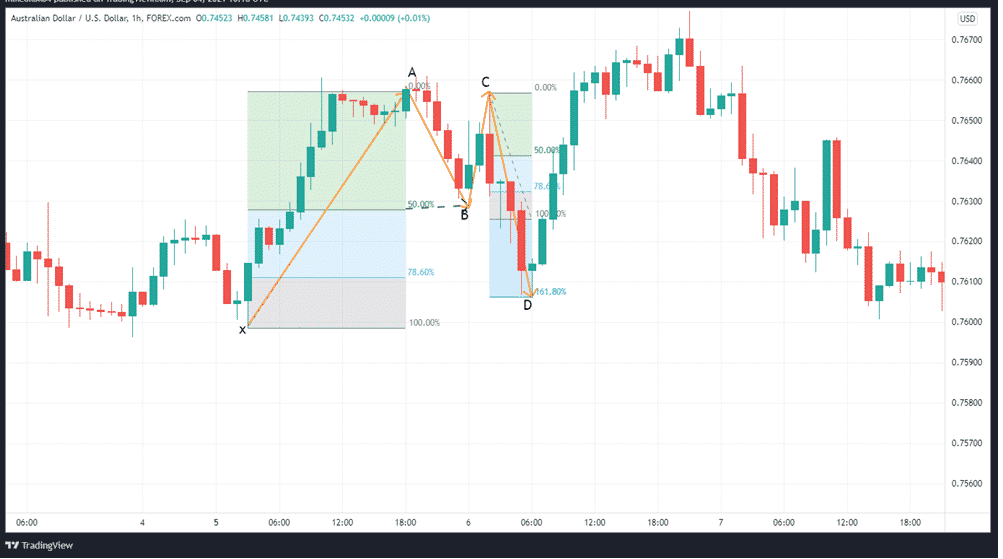
ABCD pattern
An extremely simple pattern to complete, the ABCD pattern (AB=CD) includes three distinct moves and four locations. AB takes place, followed by BC, which acts as a follow-up correction. Lastly, DC’s movement takes place, making its course the same as the first AB.
The AB leg’s Fibonacci retracement tool should place the BC leg at 0.618. It should take the same amount of time for the price to go from A to B as it does from C to D. The length of the CD line will match the AB line, and the time it takes to travel from A to B should be equivalent to the time it takes to move from C to D.
Traders have the option of entering a long or short position with an entry order close to the Potential Reversal Zone (PRZ), where the C point is located, or waiting for the pattern to finish entirely before initiating a long or short position from the pattern’s D point.
Butterfly pattern
One thing that makes this design different from the others is that the point D extends farther away from X. Below are the key pointers with this pattern:
- XA is the main path
- In total, AB returns 78.6% of the distance traveled by XA leg.
- BC follows its steps from 38.2% to 88.6% of the AB total.
- CD reaches up to 161.8% and possibly a full 261.8% of BC.
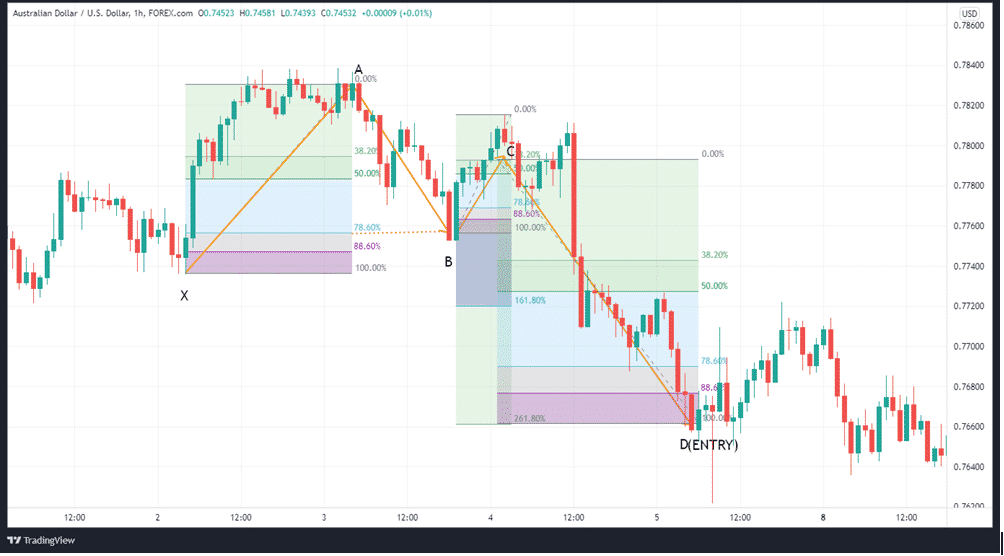
The butterfly pattern serves as a reversal pattern in the market. It’s generally found at the beginning and end of the trend. The bearish butterfly form appears at the peak of the market, whereas the bullish butterfly form appears at the bottom.
XA, AB, BC, and CD are four legs on this pattern (the X in the pattern represents the starting point, and the D represents the entering point).
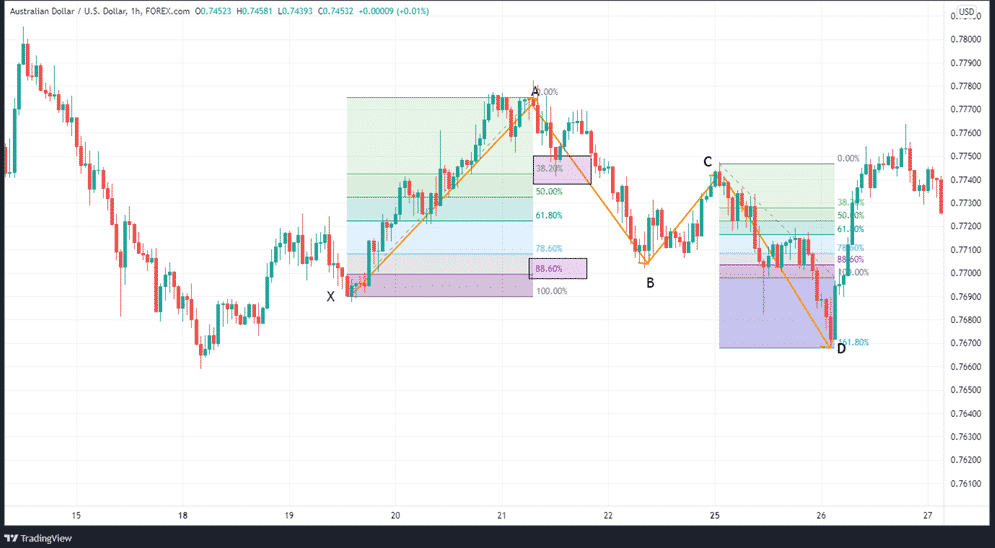
The BAT pattern
As the name implies, the BAT pattern is named after the bat-shaped appearance. The BAT pattern, as invented by Scott Carney, has exacting components that help to spot PRZs.
One of the differences between this pattern and the ABCD pattern is that it includes one additional leg and one more point, which we will call X. XA should be expected to bring a bounce off of BC. If retracement reaches B, which is halfway between XA’s original movement, then we have a BAT pattern.
- XA is the main price action trajectory. If the market is bearish, the XA is expected to climb upwards. XA will move bearish if the present market trend is bullish; however, the market will go against the bulls if XA moves bearish.
- AB is the second price trajectory following the formation of XA. The AB leg may begin at 0.382 before rising to 0.50 of XA. AB’s behavior should counterbalance the XA move’s impulsiveness.
- BC is the second trend towards XA. Despite this, the price will stay unmoved, as it will fail to push fresh lower or higher lows. BC is bound to revert to 38.2% to 88.8% of XA’s leg.
- CD: is the last milestone in the pattern, and its formation signals the best time to get in. The CD stretch should be 1.618 to 2.618 times the length of the BC leg, with point D as the entry point.
Gartley harmonic pattern
Though they appear almost identical, Gartley patterns differ from the Bat because of some minor proportional differences. The bearish Gartley pattern, which is characterized by similar ratios in each stage, begins with a XA leg down. The following are key pointers to know regarding this pattern.
- XA is the main reference upward path
- The AB leg is 61.8% of the XA leg.
- BC stays in between 38.2% and 88.6% of AB length
- CD has the ability to move by 127% of the BC extension
The following daily AUDUSD chart of the Gartley pattern provides an example.
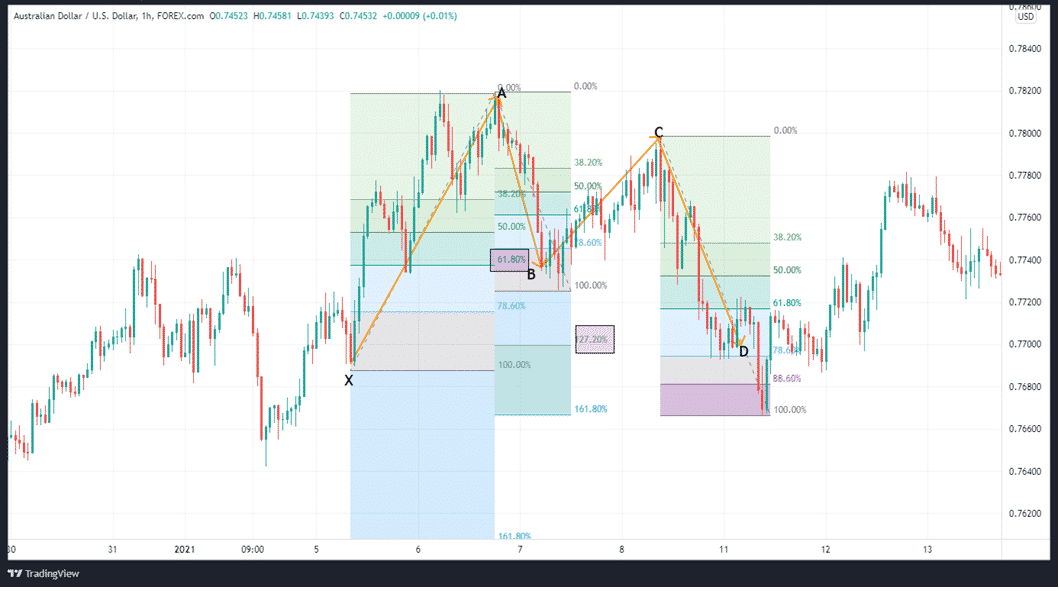
The AD profit targets are set at 0.50, 0.618, 1, and 1.618. This may help to build the foundation of future upward and downward trends.
The crab pattern
The crab uses a sequence of X-A, A-B, B-C, and C-D to give traders the opportunity to join the market at either extreme highs or lows. To understand the crab pattern, we must first identify the 1.618 extension of the XA movement, which is what governs the PRZ.
The following are the key pointers:
- XA is the main path
- In total, AB returns 78.6% of the distance traveled by XA leg.
- BC follows its steps from 38.2% to 88.6% of the AB total.
- CD reaches up to 161.8% and possibly a full 261.8% of BC.
In summary
One way to make consistent profits in the market is by using harmonic patterns, a method that can benefit traders who enjoy conducting price analyses and investing strategies. However, one should always bear in mind that there are patterns that do not function properly.
Even if the price reverses, it may only move slightly before reversing in the opposite way. This means that you will have missed both the PRZ and your profit target and increased your risk exposure. Hence, it is crucial to employ stop-loss orders to keep risk in check.