One of the biggest challenges in trading is the ability to adapt to the current market state. If there is a ranging market, we will use one type of tool, and if the market is trending, we need to use other tools.
The Bollinger Bands indicator helps us to cope with this challenge in both ways:
- The indicator helps to determine the market state we’re in.
- Bollinger Bands offer simple strategies for both states of the market.
One of the best sides of the indicator is its simplicity of use and the straight forward way of how it’s built.
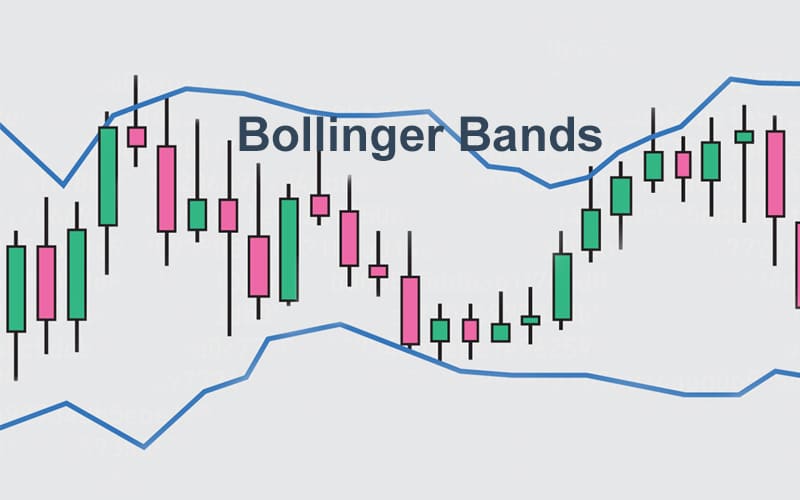
Bollinger Bands consists of the following parts:
- An upper band
- A middle line (SMA)
- A lower band
An upper band is located two standard deviations above and below a middle line. Two standard deviations above and below SMA contain 95% of the price moves that happened within the calculated period. It gives us a mathematic basis to expect the price to remain in the range.
Bollinger Bands, like many other indicators, should be used in conjunction with other signals of your choice. Other signals should preferably not be based on the price of its own, but on time, volume, market structure, etc.
The story behind Bollinger Bands
Bollinger Bands indicator was developed in the early 1980s by John Bollinger. John A. Bollinger is an American financial analyst and author. Back in the 80s, Bollinger was an independent options trader and had to analyze volatility for his trading decisions.
The change of volatility paradigm
Before creating the “modern” Bands, Bollinger used widely popular at that time percentage bands. Percentage Bands is a moving average shifted up and down by a particular percentage from the current price. It was easy to calculate them without computers. During the time of the creation of the Bollinger Bands, volatility was believed to be constant, so Bollinger and his fellow traders would adapt the percentage manually for each company. The problem was biases. The bands’ percentage would be affected by individual opinions about the market. Bollinger was one of the first traders who viewed the volatility as dynamic. Bollinger used the Bands to visualize the dynamic volatility.
That created the ground for the idea of adaptive bands based on standard deviations. Bollinger focused on the overlap between fundamental and technical analysis, attempting to use the strong sides of both for the market analysis. He later added the quantitative and behavioral analysis to his broad approach to market analysis.
Adapt to the market with Bollinger Bands
Bollinger bands help traders to identify the market condition they are in. Look at the chart below.
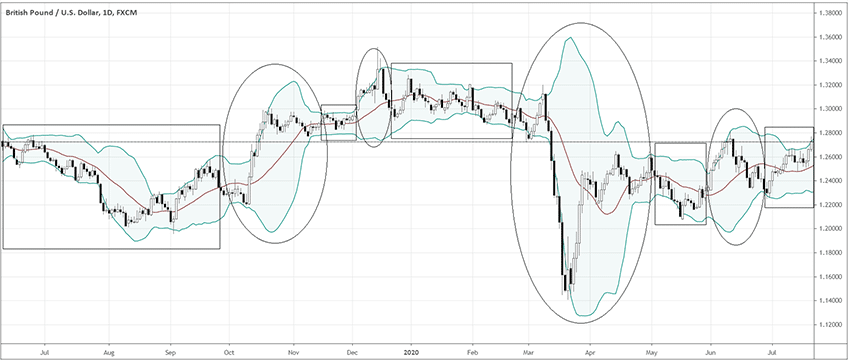
We can see that when the bands are close to each other, the price action stays in the narrow range (rectangle areas). So, we can conclude that we are in the range market. Thus, some traders would just abstain from trading and wait for the return of a trend (oval areas). Those that don’t mind trading in a range would need to use a specific set of tools and strategies to trade in this market state, such as oscillators and the rebound candlestick patterns. Even if you don’t like to use the bands as the dynamic support and resistance, the narrowing of the bands can give you a reason to look at the market from a different stance.
Eventually, you can draw your own support and resistance and base your entry signals on them. Often, manually drawn lines, moving averages, and other forms of technical analysis align consistently with Bollinger. That gives a reassurance of viewing the market objectively – as the broad public views it, employing different methods of analysis but coming to the same conclusion.
Depending on the intensity of your trading style, you can adjust the period of Bollinger bands. The lower period would make the Bands more sensitive to the latest price change. Conversely, the higher the period is, the “slower” the Bands become. The standard settings in many software packages are 18-21 for moving average, although Bollinger suggests using 9-12 for day trading.
Protect your robot from false signals
It’s easy to set the Bollinger Bands as a filter condition for an automated trading system as well. For example, if you develop a trend following algorithm, you can set a condition such as
“if Bollinger bands are at X<% close to the MA, <=80% of the time, for X number of days, and the current candle’s close <=upper band and >=lower band, then the entry conditions are not applicable”, – this rule will protect your system from taking signals in a range market.
Bollinger Bands common strategies
Bollinger bounce
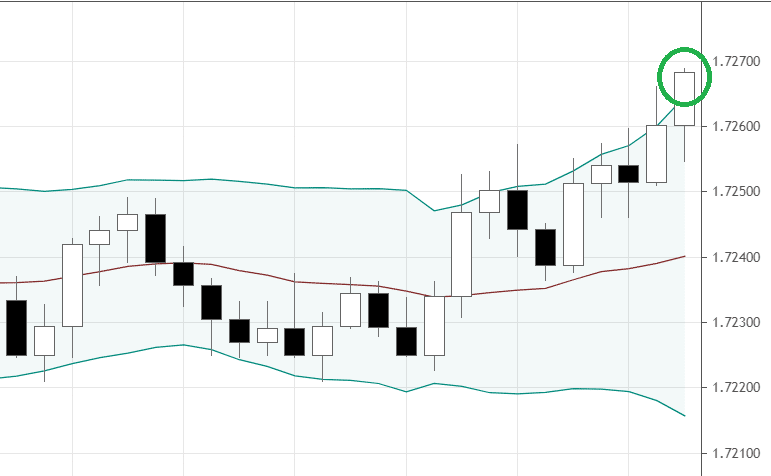
The price tends to stay around the middle of the bands, or at the “mean”. Look at the chart below. How do you think where would the market head next?
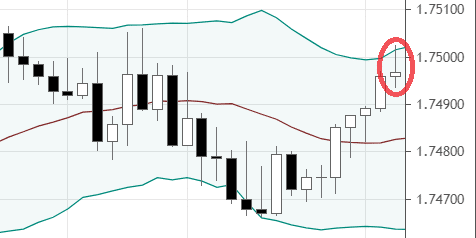
If you thought it would go down, then you are right! From the next chart, you can see the price nicely returned down to the middle of the bands.
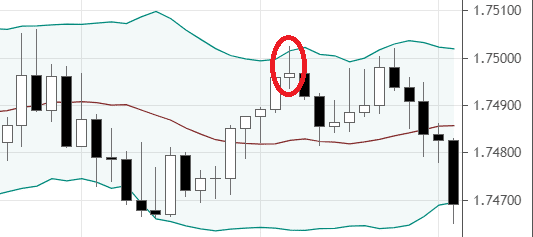
We can use this pattern to trade the rebound from the Bands. When the price approaches one of the bands, we can open a position towards the middle area of the bands. So, if the market approached the upper band, we would open a short position, and if the market approached a lower band, we would open a long position. Ideally, the actual entry signal is confirmed when we have some candlestick pattern around the upper or lower bands. Other words, we need a price action trigger to tell us the actual moment when the price might be ready for a reversal within the range. Keep in mind that you should consider these kinds of signals only when the bands are consistently narrow or, ideally, even contracting. If you see the bands expanding, it might signal the coming of a trend, and it’s dangerous to take the rebound signals.
Bollinger squeeze
The biggest trends usually start from the breakouts of the lengthy periods of consolidations. Bollinger Bands can generate entry signals to trade those breakouts and jump at the beginning of trends.
We will have a buy signal if the candles breakout above the upper band and close there. We can expect the market to continue to go up afterward. The vice-versa applies for a sell signal.
Let’s analyze the chart above. The price just broke out above the upper band and closed significantly higher. Where do you think it would go?
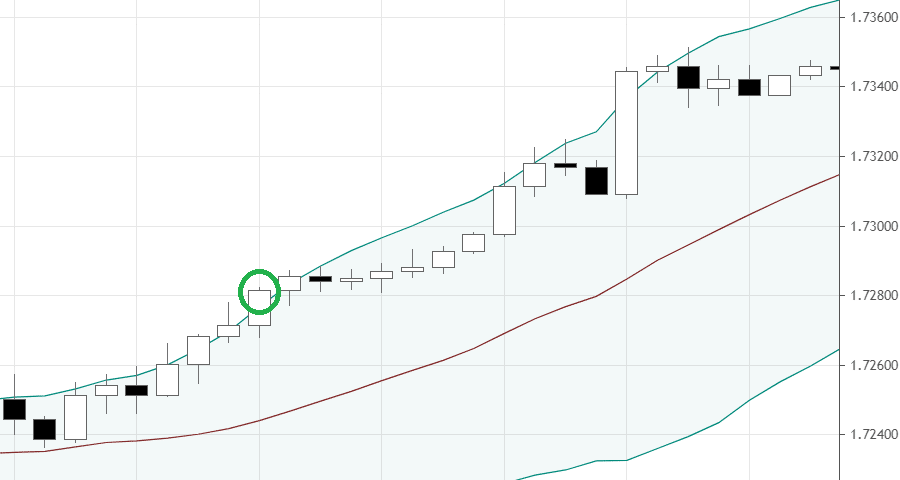
If you said to the north, you’re right again!
Trading these kinds of breakouts can get you at the very beginning of a trend. Although the win rate is around 30% to 40%, the vast potential rewards make up the losses and leave you in profit after a sufficient sample of trades.
Conclusion
Bollinger Bands indicator was created as the result of evolution in understanding the nature of the market volatility. The indicator adapts to the current fluctuations and helps to identify what state of the market we are in. With Bollinger Bands, we can have two kinds of entry signals: rebound within the range (also called “Bollinger Bounce”) and the breakout from the range (“Bollinger squeeze”). The simplicity and efficiency of the indicator can contribute to building automated trading systems with the ability to adapt to the market.