Volatility Indicators are a powerful tool used by traders and market analysts globally. They can help develop a clear and elaborate image of the market scenario for smart decision making. Read more about what these indicators are and how you can use them to optimize your profits.
What are Volatility Indicators (VI)?
Volatility indicators are an effective tool for financial and technical market analysis that helps form sound trading strategy. VI are based on price actions. They measure volatility, i.e. the rate at which an asset’s prices fluctuates in the market during a given period of time. This decides the span of returns or the dispersion which an asset accrues for that time. When the prices do not fluctuate often, the market is said to have low volatility. When they fluctuate very frequently, the market is said to have high volatility. For traders and investors, it is crucial to keep track of market volatility regularly. It is a sign of new values registered for market highs and lows. A highly volatile market moves unpredictably, making it risky for players to remain in the game and make profitable decisions. But it is also an opportunity for experienced traders to make use of the price instability to optimize their investments.
There are a few technical indicators that you can use to measure volatility. The most popular measures are Standard Deviation (SD), Average True Range (ATR), and Bollinger Bands.
How to use the different types of Volatility Indicators:
Standard Deviation (SD)
Standard deviation is a statistical marker that calculates the dispersion for any given information. It is measured using the mean value and the variance of the data. Simply put, SD measures how far individual values are from the average of the information given. The higher the standard deviation for a security, the more volatile or unstable prices are in the market. The lower the standard deviation, the less volatile the prices are in the market. Mathematically, the standard deviation is the root of the variance.
The formula for standard deviation is – Standard Deviation
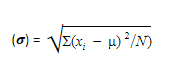
- Where μ, is the mean of the price. The mean is calculated by adding all the prices and dividing them by the number of days to get the average price.
- Xi are the individual prices for each day.
- N is the number of units considered.
Using the standard deviation can help brokers, analysts, advisers and traders to make important price-related analyses based on how far the prices are from the average value. It also helps forecast the behavior of prices in the future by observing the trendline vis-à-vis the standard deviation and variance (𝝈2). Standard deviation is highly effective in identifying and removing market noise and extreme values, allowing traders to focus only on vital price changes and steer clear of irrelevant fluctuations.
Average True Range (ATR)
The Average True Range is one of the most potent tools to measure volatility for an asset. It functions by shifting above or below the origin when the asset’s price fluctuates. It shows the average price movement during a given period of time. Traders employ the ATR to make decisions about placing entry and exit points. Using the support and resistance levels with ATR, it can also be used to set a stop-loss on buying and selling to prevent major loss caused by falling prices. This gives traders an edge over unexpected trend reversals.
An ATR is calculated generally over a 14-period moving average. The moving average value is filtered out to eliminate market noise and form smooth lines. Based on different candlestick formations, you can generate the ATR in three different ways:
- ATR = Present High – Present Low
- ATR = Present High – Previous Close
- ATR = Present Low – Previous Close
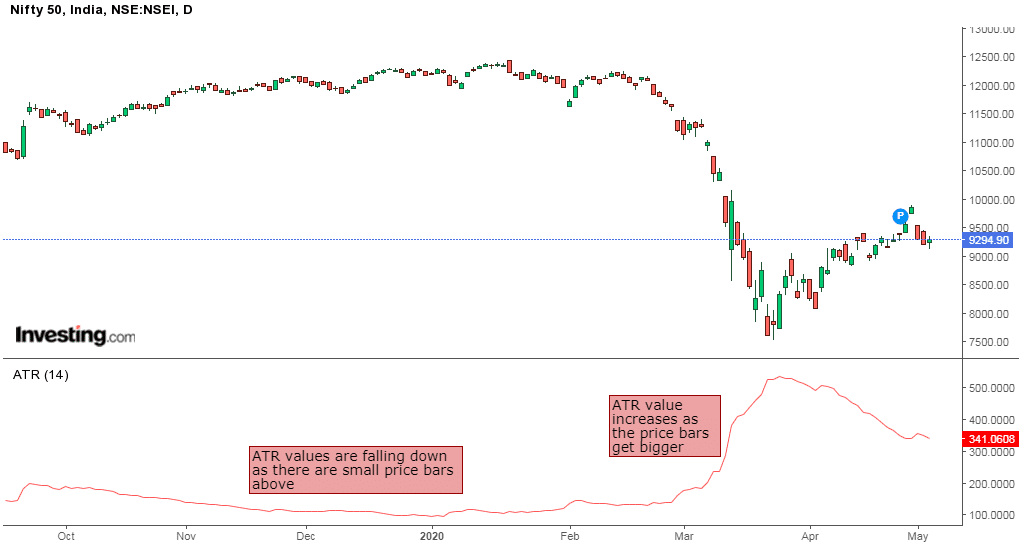
The values of ATR are low initially as the price differences are small. As the price differences in candles increase, the ATR rises. A high ATR indicates high volatility and a low ATR indicates a low volatility for an asset.
Bollinger Bands (BB)
Bollinger bands calculates the market volatility based on previously recorded prices. The prices are taken in relation to historical highs and lows. With fluctuations in the asset’s price, Bollinger Bands measure the standard deviation for the priceline. The standard deviation causes expansion or contraction in the bands. A highly volatile market has wider bands whereas a less volatile market has thinner bands.
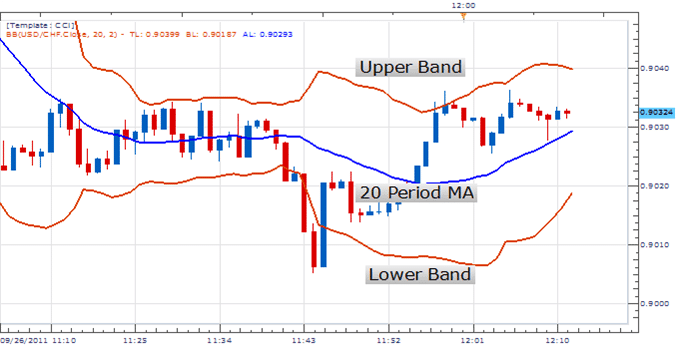
There are three bands that together form the bollinger band for an asset – the upper, the middle and the lower band. The upper and lower bands denote deviation from the middle band, which is made of a customisable simple moving average. Although most charts use a 20-period moving average for the middle line, you can change the value based on your trading goals. Day traders should keep shorter periods for the middleline whereas long-term investors should have longer moving average periods. The interval between the upper and lower bands and the middle moving average represents market volatility and high and low values for the asset.
Bottom Line
An enterprising trader should keep track of volatility to safeguard themselves from any uncertainty and always be one step ahead in the game. Volatility indicators, such as the Standard Deviation, Average True Range, and Bollinger Bands can help you make improved judgments and strong decisions to maintain your portfolio. When used with other technical and financial indicators, they are a powerful and reliable tool for strategic risk management and market research.