When any individual or organization trades stock in the market, they leave a footprint behind. When volume increases, the price bar printed on a chart may also increase. When we string enough of those price bars together, they form what we call “chart patterns.”
So what is a chart pattern?
Also known as price patterns, chart patterns are a type of pattern placed on a chart that plays a major role in conducting technical analysis. In other words, it’s simply a specific formation on a chart that can be viewed either as a trading signal or as an indication of a future price movement. There are a multitude of chart types available. However, they feature the same basic information, which is price movement.
Why do we use chart patterns in trading?
Chart patterns play a major role for technical analysts in trading markets, especially the stock market. They help traders in deciphering two major signals necessary for profitable trading. Clear buy signals and sell signals apart from providing other advantages.
Buy and sell signals
There are two major situations that you can regard as signals to sell or buy that you should look out for:
- When prices close above the trend line boundary of any chart pattern, it’s considered a buy signal. A trading signal can also occur when prices close either above the top or below the bottom of a particular chart pattern.
- Sell signals are triggered when the price closes outside a trend line boundary or below the bottom of a chart pattern.
Setting a price target
Chart patterns give us an estimate of where the price might go. This is known as the measure rule, which is based on the height of the pattern. These estimates serve as a minimum price move. In other words, the height of a chart helps us to set a price target.
The goals of analyzing chart patterns
The main goals of analyzing chart patterns are discussed here in brief as follows.
Defining a set of rules that result in winning trades
There are specific rules that you can use to assist you in reacting and trading with a particular pattern as it forms from its base and culminates in the move that it started with.
Identifying the most predictable patterns possible
By analyzing different chart models, you can easily isolate the patterns which you think gives you an edge in the market and ignore the others.
Ensuring losses are smaller than gains
More than 50% of your trades should make you money. Even when you lose, you will have to ensure that the losses are much smaller than the gains. Managing your losses to a small value is all that you need to generate a good healthy profit on a weekly basis. Chart patterns let you do that. By short-listing and focusing on those chart patterns that actually work, you are ensuring that losses are kept smaller than profits.
Limitations to avoid in using chart patterns
Chart Patterns have their own set of limitations. For instance, if you don’t see a chart pattern until after the breakout, you may have lost some profit when the price moved away from you. Some of the limitations of using charts are explained in brief below.
Proper timing
After finding an appropriate chart to use, you have to put it to use in a timely manner. You have to be patient with them. While it’s completely possible to buy a stock at any time and earn profits when the stock moves higher, breaks out, and forms a chart pattern, there is a possibility of the stock dropping as well. In this case, waiting for the breakout is often the best option, but this requires patience. But if you are late finding a chart pattern altogether, its usefulness declines.
Stop placement can be tricky
Stop placements can be tricky when using charts. Price can often breakout upward and then return to the pattern. The breakout is still considered valid if the stock doesn’t close below the bottom of the pattern. If you sell at this point, you can suffer a substantial loss. You can rectify this problem by using a closer stop.
The problem of tall chart patterns
Handling tall chart patterns can be tricky as it can be an indication that you are closer to the end of the trend than the beginning. For instance, in a chart pattern that extends from the bottom of the screen to nearly the top, a substantial rise may have already occurred by the time you receive a buy signal. This may mean that you are closer to the end of the uptrend rather than its beginning. This limits the upside potential.
Advantages and Disadvantages of using different Chart Types
| Type of Chart | Advantage | Disadvantage | Graph |
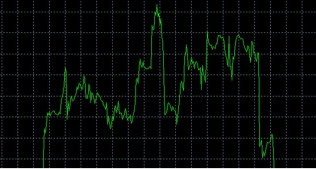
| Line Chart | It is convenient, simple, and does not give you any excessive information. | Several price movements are overlooked, making it impossible to measure the presence of gaps. |  |
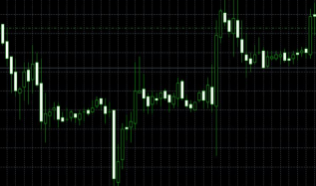
| Candlestick Chart | It is convenient for displaying price information in terms of its visual perception. | It provides an overabundance of information that can confuse traders. |  |
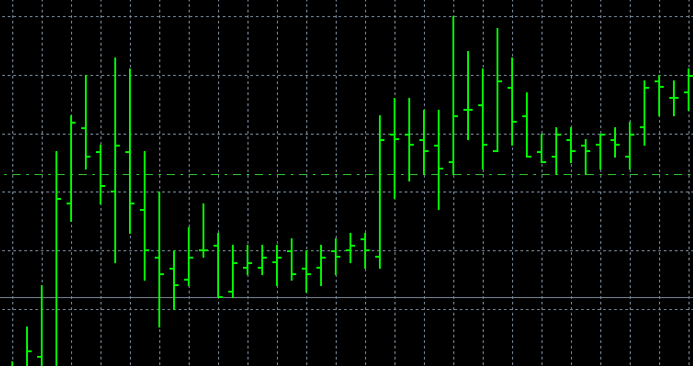
| Bar Chart | It provides complete information and allows traders the ability to determine the range of trades. | There is difficulty in assessing the period as it is visually less convenient to determine whether an asset has grown in value or fallen over a certain period of time. |  |
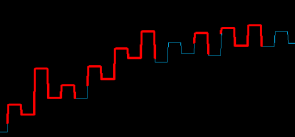
| Kagi Graphic | It provides a visual representation of the main trend by averaging the price and ignoring time. | It overlooks many price movements. It is impossible to identify the minimum and maximum of individual intervals. |  |
Final Thoughts
Chart patterns often form shapes that can help you pre-determine price action, such as reversals and stock breakouts. By recognizing chart patterns, you can gain a competitive advantage in the market and add value to the quality of technical analysis you are conducting. However, simply following rules blindly and over-relying on any one chart pattern can result in quite the opposite situation, where you can lose money instead of making it. You thus have to ensure you avoid making such mistakes while dealing with chart patterns, especially while trading stock and forex.
