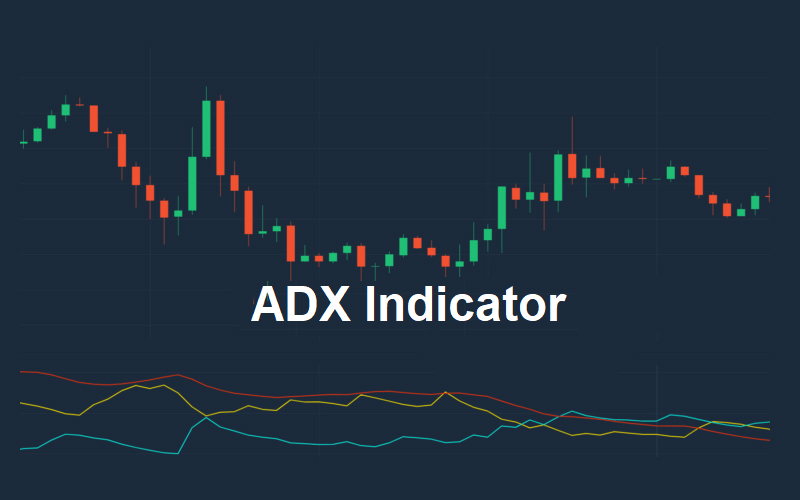
Introduced by J. Welles Wilder, the ADX indicator was designed as a technical tool to help traders adapt their strategy to the market trends instead of making decisions based on unreliable assumptions about the strength of market trends. Originally designed for the daily commodity market, the ADX has established its place as one of the many widely-used indicators and is readily offered by the many trading platforms.
Understanding the average directional index
A component of the Directional Movement System, the ADX indicator serves the following purposes:
- It notifies the user when the market is trending and how a financer can estimate its strength.
- It determines the trend range – you can also use it to zero in on specific forex trading strategies.
- It helps to rule out anti-trend trades assisting trend-chasing indicators from struggles.
ADX can be measured using charts. Below is a graphical representation, indicating ADX touching a low of 20 at a certain time. However, the value climbs up and above 50, intimating a strong trend soon after – that indicates an uptrend, and investors can begin plugging in their investments.
How does ADX work?
Let us now understand how you can use the indicator to understand trends. Let us also find out the significance of its positive and negative values.
Directional indicators (positive and negative)
The ADX indicator is based on two-directional indicators, namely:
- The positive directional indicator (+DI).
- The negative directional indicator (-DI).
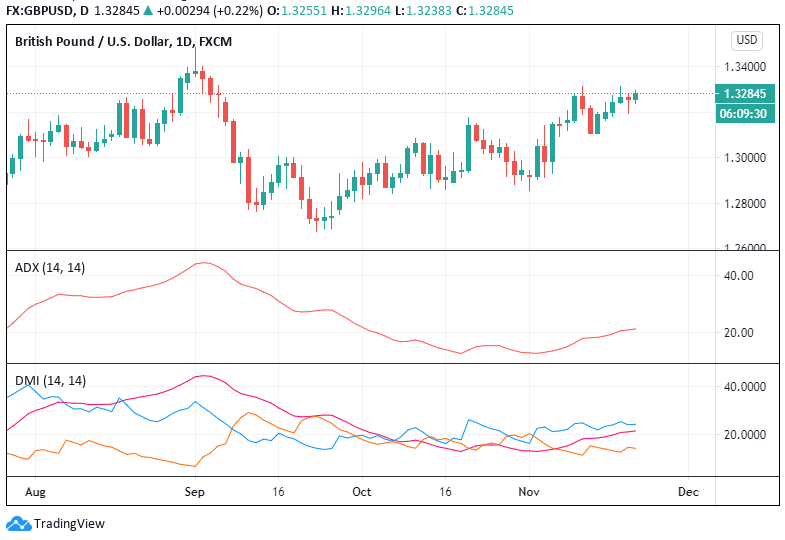
These show how the trend’s direction jumps as per market movement direction. This change leads to the estimation of the ADX, which is represented by the red and pink lines in graphs 2 and 3. In every period, the market records some crests and troughs in trends, and these changes are responsible for the directional movement.
Investors can compare the variations between the crest and troughs of two consecutive periods to understand the directional movement. The values of directional movement may vary from one time period to another, and that ranges from a positive to a negative, and can also be a zero.
You get a positive value for directional movement when the resultant deduction of the current high and the previous high is not only positive but also greater in amount compared to the difference between the prevailing low and the previous low.
The negative directional movement is not very different, and it is based on the contrast between the previous troughs and the current trough. The value is similarly positive when it exceeds the resultant subtraction of the former high and the present high.
Why they matter
The importance of ADX lies where you can decide on the trend of business based on your DMI results. Investors know that prices are moving up when the +DMI (blue) is ahead of the -DMI (orange). During such cases, we observe an upward trend in ADX measures. Similarly, the downward stoop of market prices is depicted when -DMI (orange) surpasses the +DMI (blue), showing the strength of the downtrend.
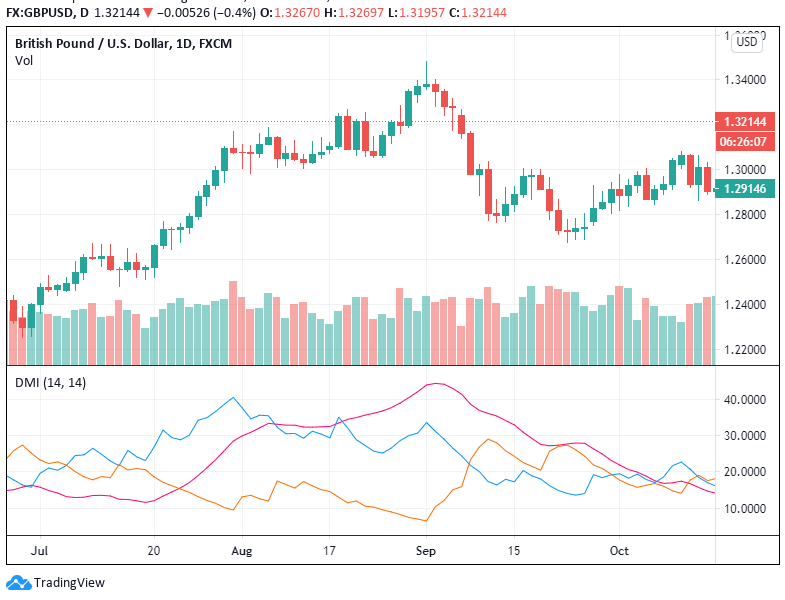
Let’s analyze the chart above for more clarity. Notice how the chart shows a reversal in the uptrend, which finally becomes a downtrend. This chart shows the rise of ADX through the uptrend when +DMI > -DMI. When the price transposes, the -DMI rises above the +DMI. It is followed by the ADX to determine the strength of the downtrend.
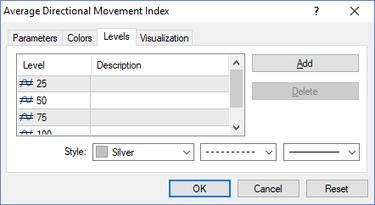
If you are new to ADX, you might find the calculation to be troublesome. However, you don’t have to do it manually – the existence of modern trading software makes these calculations a piece of cake! MetaTrader 4 is one such software with an indicator that makes the job easy.
How to read the ADX indicator?
So far, you’ve seen a trend analysis using the ADX indicator. But the process remains incomplete if you are not able to read the values. How can an investor learn when a trend occurs?
ADX value has a range from 0 to 100. Wilder had proposed this view that values greater than 25 imply a trending market. On the contrary, we call no trend if the value is below 20. These values are oscillating, and they resonate between 20 and 25. Keeping this in mind, many professionals accept 25 as the threshold point within ‘trend’ and ‘no trend.’
Estimating trend strength
ADX directional system can be used as confirmation if the DMI pairs could likely continue in its current trend without bringing a change in market sentiment. ADX can rightly be used to tell whether an investor should close a trade early, based on its values. A value between 0-25 indicates that the current trend is losing its potential. The trend strength is considered to be strong, up, and running if the value is between a quarter and a half a century.
Suppose the value lies between half to three-quarters of a hundred. We can say that the trend is fairly strong. As the ADX value reaches close to a century, we can hands-down say that it is a remarkably solid trend. These values are mapped to some properties, which we can find in the application that shows us the ADX.
The execution of this operation in Metatrader 4 is presented below.
Final Thoughts
When trading, it is often not easy to discern whether the trend will continue or reverse. Under such circumstances, the ADX acts as a differentiator to help you understand the technical signals and make the right calls. Traders often use this to develop a better strategy and maximize profits.