Delta is the difference between the bid supply volume and the ask demand volume.
The delta can be positive or negative and there are several ways to interpret this indicator. We can interpret the readings as the strength of a trend.
For example, if delta is a high positive number it means that aggressive buyers entering the market with ASK orders take control of the candle or the trend. If, on the other hand, delta has a high negative number, it is indicating that aggressive sellers who have entered the market through BID have taken control of the candle or the trend.
For users of cumulative delta, a market order is considered aggressive and a limit order is considered as passive. The action of a person hitting the bid or offer is considered one of more urgency.
The Cumulative Delta calculation is Market Buy Orders – Market Sell Orders. If the Cumulative Delta is positive, then we have more aggressive buyers. If it is negative, we have more aggressive sellers. This is the basis of delta analysis.

Price Action
Price action is the study of how the price of an asset behaves over time. If the price of a stock goes up, a price action trader generally does not care to explain the fundamental reasons why this happened, he uses price action as his main source of information to make trading decisions.
So what we are doing is studying the way (action) in which the value of an asset (price) behaves over time.
Does price action trading really work?
To answer this question, we need to understand why price action trading makes sense; in the first place and there is no better way to do it than by looking at a chart.
During your trading career, you will find that many newbies start trading price action mechanically, they just look at a pattern on a chart and expect something to happen just because the pattern is there, it could be “head and shoulders” or any pattern. The thing is, there are actually some compelling reasons this all makes sense, beyond pattern recognition, here’s why:
When a beginning trader looks at the chart below, they simply analyze the fact that there could be a potential breakout waiting to happen because that’s what everyone is saying.
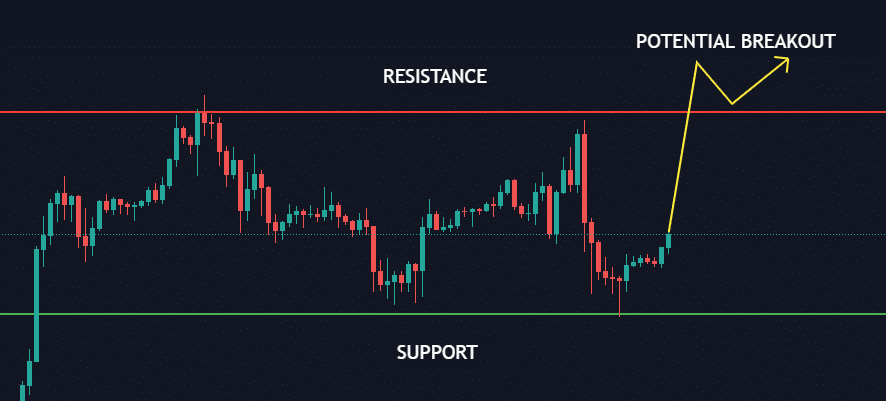
But if you stop for a second and think, what determines the possible price actions? Well, the actions of buyers and sellers! They are the ones responsible for driving the price and generating the price action, right?
Now let’s look at the same graph and imagine that you are telling us a story and that this story is based on the actions that buyers and sellers took in the past.
So what does the story say?
Every time the price reached a certain higher level, there was a large concentration of supply that brought it down (which means that there were many sell orders at that level).
Every time the price reached a certain minimum level, there was a large concentration of demand that caused the price to rise again (which means that there were many buy orders at that level).
When the price reached that upper level and there was not enough supply to keep the price high, it took off and that is why this scenario is called a breakout.
The most important thing to learn from this story is that all of these things happen because buyers and sellers are taking actions that ultimately affect prices in a certain way and precisely because these observable patterns occur, we can come up with possible predictions of future price behavior.
What to look for
Cumulative Delta isn’t something you can use to give objective, rules based signals. You can’t just jump in when there’s a divergence between price and delta. Cumulative Delta is similar to the art of Tape Reading in that it helps to paint an overall picture of what is happening. Cumulative Delta will help you make trading decisions but it shouldn’t be the only factor. The key consideration is that Cumulative Delta will generally move with the price and when it doesn’t, it is time to pay attention.
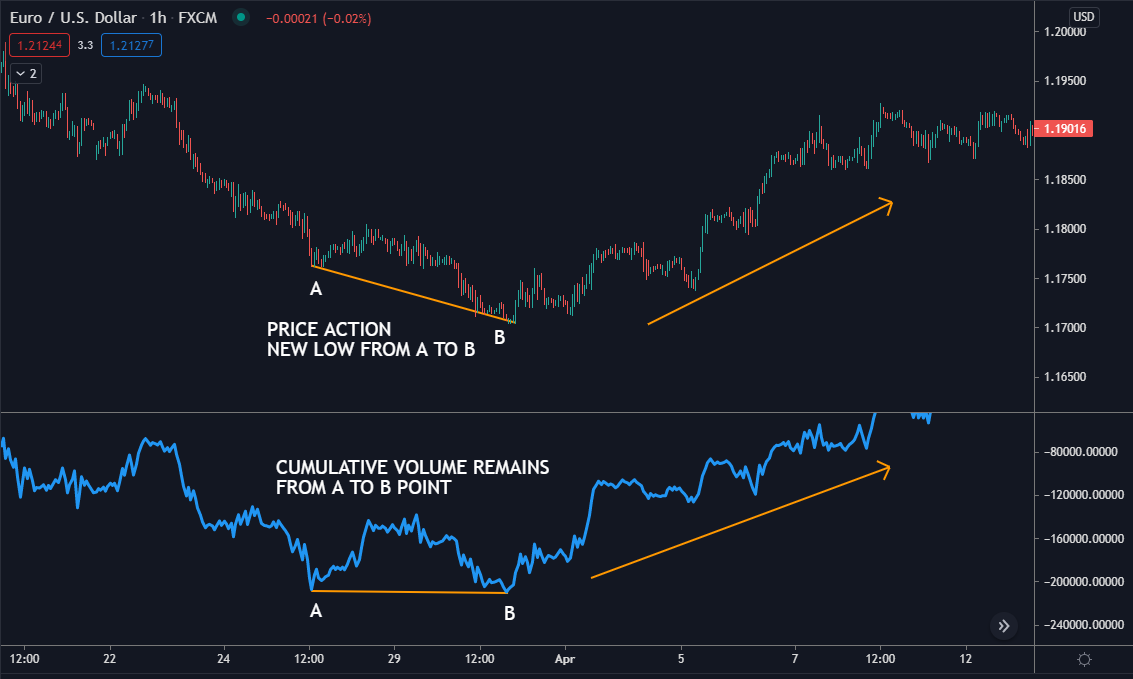
For this strategy I like to use time frames like 5 min, 15 min or 1 Hour to catch Delta Volume Divergences with price action.
I will give you examples
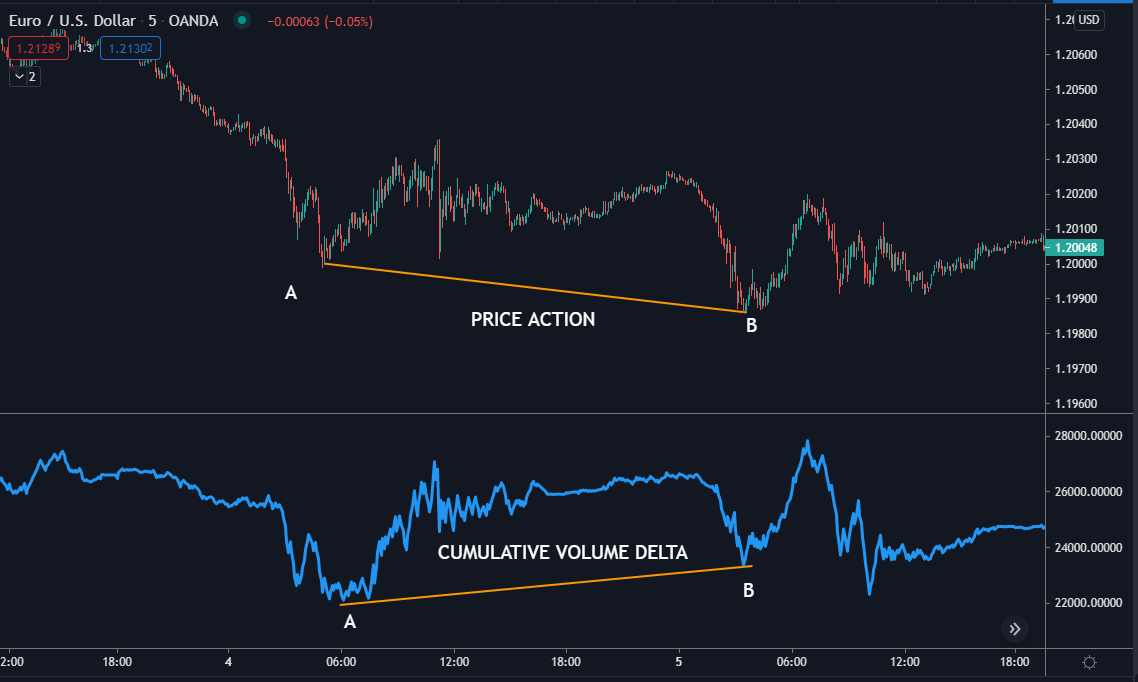
In the above and below screenshot, we can see that from points A to B, delta was not moving with the price. In this case Delta helped us to see the lack of seller participation, for this reason, point B is a good entry zone.