
Reversals are a common occurrence in the forex market. They happen whenever the price moves strongly in a given direction resulting in overbought or oversold conditions. When such situations arise, specific chart formations occur that act as a warning sign of potential reversals.
What is a Broadening Bottom?
Broadening Bottom is a common chart pattern that occurs whenever a currency pair has moved lower significantly. Consequently, it acts as a warning sign that a bounce-back could occur, resulting in the asset price reversing from a downtrend.
Given that the pattern occurs in a downtrend, it acts as a bull market reversal signal prompting buyers to be on the lookout for potential entry points. Similarly, it acts as a warning sign that short sellers need to exit positions as the downtrend is losing momentum, and a correction could occur.
While looking to profit from this setup, it is important to be extremely cautious. This is partly because the unique pattern is characterized by lower lows hinting at short sellers in control and higher highs signaling a buildup in upward momentum. The pullback to lower lows only goes to attract bulls looking to buy at extremely low levels, consequently taking the price higher.
Structure
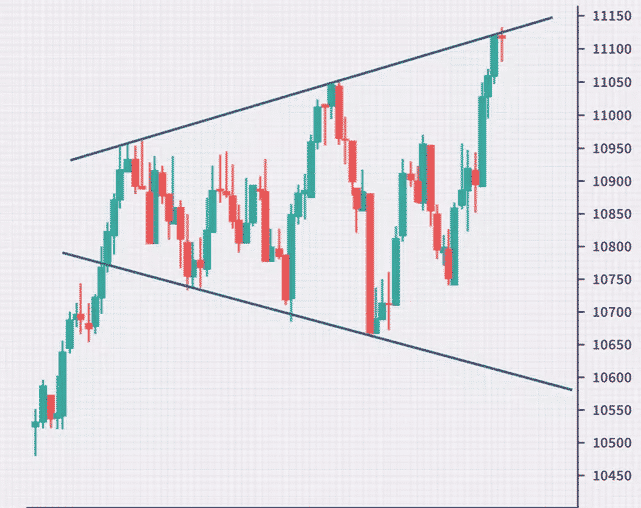
The broadening bottom pattern has the appearance of a megaphone formed at the end of a downtrend. The pattern is formed by two divergent trend lines. In this case, it appears as an inverted triangle or an open triangle.
It is characterized by price making higher highs and lower lows. The oscillation, in this case, acts as a form of consolidation, with the lower descending trend line acting as support. The oscillations between the two trend lines become more sizable as time goes on.
The broadening of the symmetrical triangle signals the growing nervousness in the market. In most cases, it implies indecisiveness whereby bulls cannot take the price higher while the short-sellers struggle to trigger a significant move lower.
A reversal occurs mostly when the price has made at least two higher highs and two lower lows. After the second lower-low, there is a tendency of price edging higher with force powering through the previous ascending trend line signifying that bulls are in control.
How to trade Broadening Bottom
Strategy 1
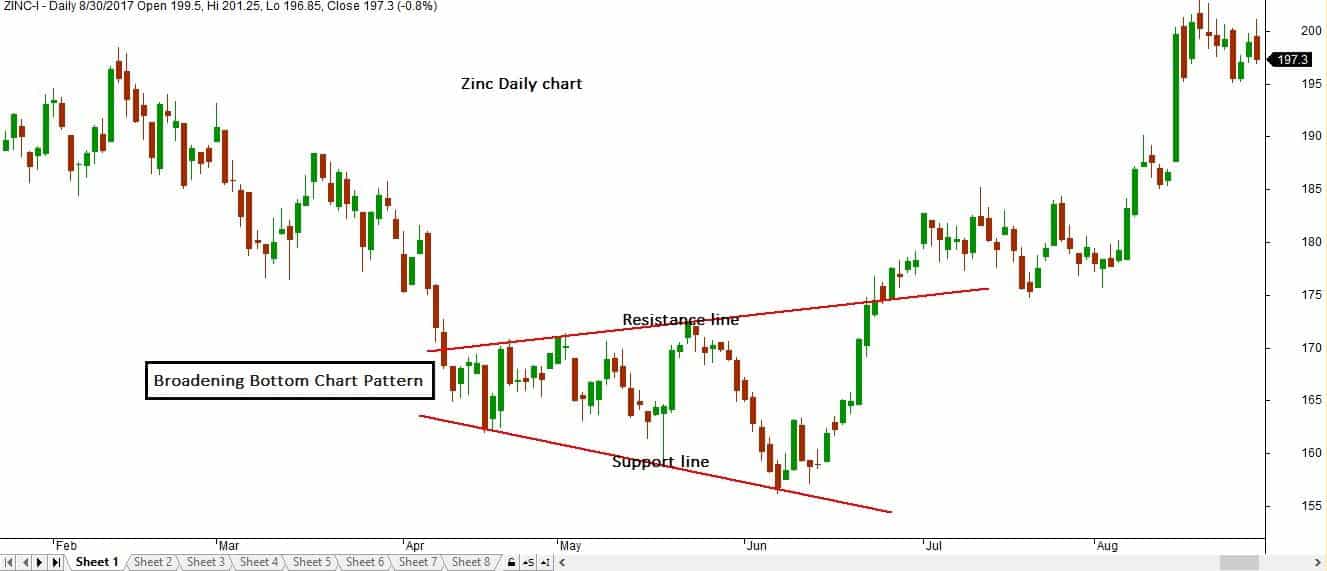
With the lower descending trend line acting as a support, one can look to enter a long position as soon as the price bounces off the support level. The signal to enter a buy at the descending trend line should come in the form of a bullish candlestick, signaling that bulls have overpowered short sellers.
The illustration below shows how the instrument rebounded from the support, forming bullish candlesticks.
Buying at the lower end of the broadening bottom is the most aggressive way of playing the setup and offers an ideal opportunity to buy at the lowest level possible. In this case, the prospects of generating significant profit are usually high, given that one is buying at a low.
Ideally, it is crucial only to enter long once the price has oscillated and formed two lower lows. The third lower low should be eyed closely as it often signals the exhaustion of the downtrend and a buildup of buying pressure which causes the price to re-rate higher with high volume.
Strategy 2
While trading this pattern, caution is of utmost importance, given that the broadening bottom can continue for quite some time. In this case, the price can keep moving higher, forming new highs only to retreat and lower lows on the descending trend line.
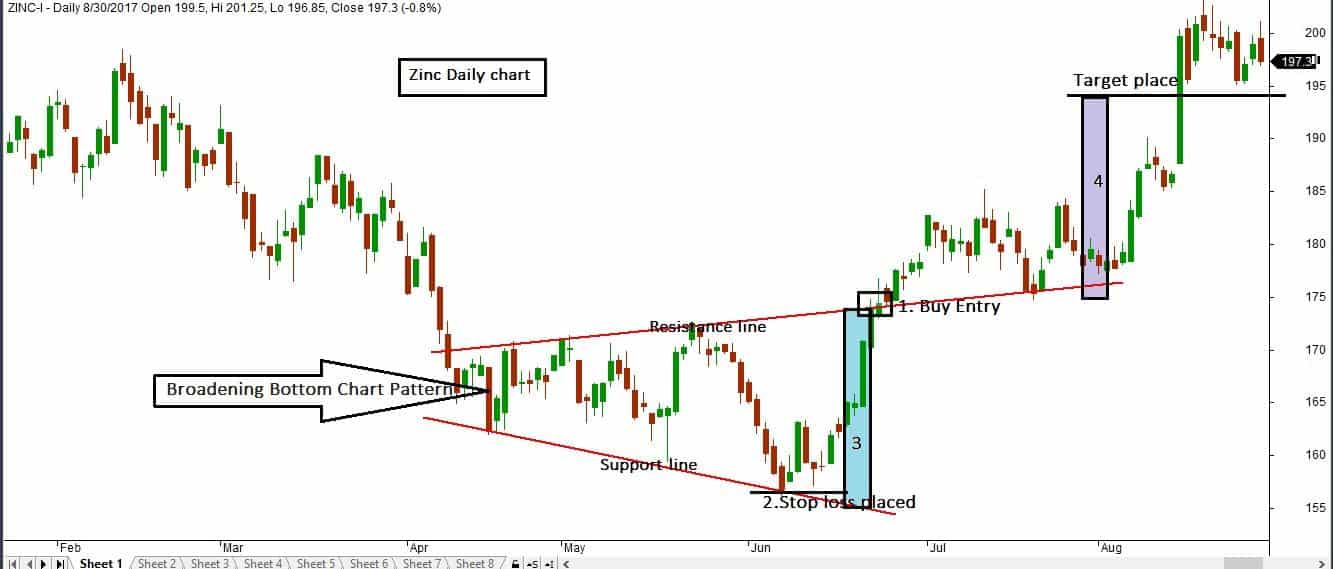
Consequently, a breakout from the broadening bottom line will be the only assurance that the price has reversed. In this case, one can look to open a long position as soon as the price breaks out of the upward ascending trend line and closes above.
The image above shows a possible entry at the breakout, the stop loss, and the target.
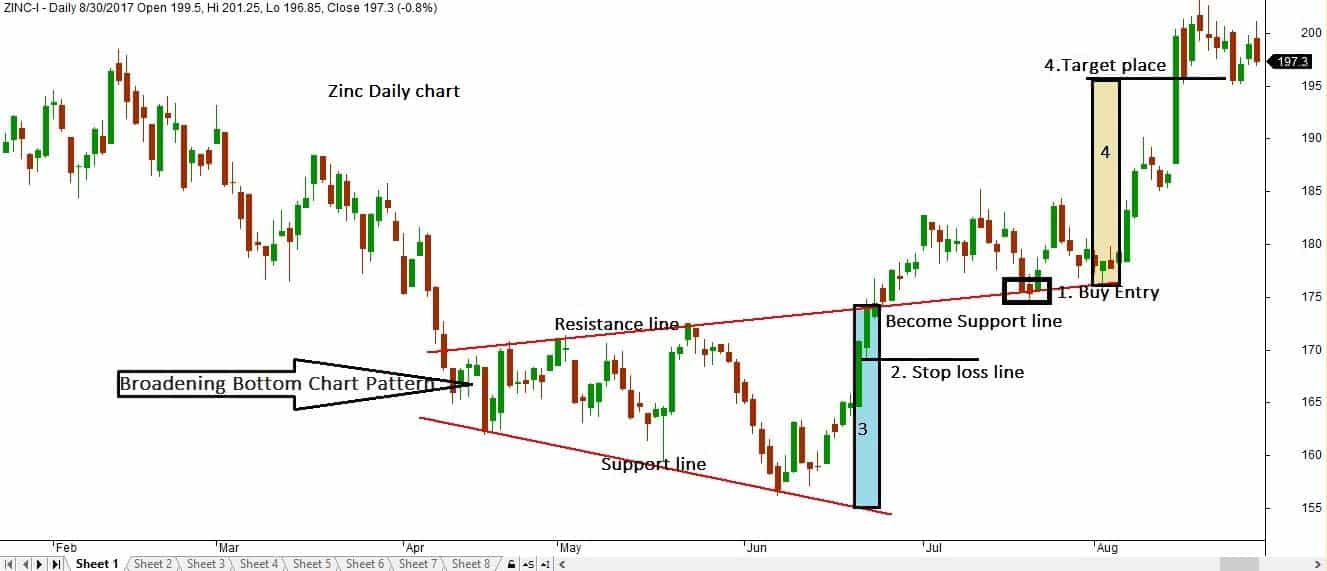
While the first breakout of the broadening bottom might fail, it is important to wait for the price to pull back to the ascending trendline after breaking out. If it fails to edge lower inside the broadening pattern and starts moving up, this would be the best time to enter a buy position.
In the following chart, we can see an entry at the pullback, rebounding from the resistance-turned-support. In this case, the adequate stop loss is closer. Thus we can get a better risk/reward ratio for the trade.
Price breaking out of the broadening bottom and edging higher instead of coming back signals bulls are in firm control and that the downtrend has come to an end. Conversely, the price is likely to continue edging higher in line with the emerging uptrend.
The exit level with this formation should always be the previous higher high of the pattern. In this case, one can place a stop-loss order slightly below the last higher high inside the pattern once the price has broken out.
Things to remember
The broadening bottom pattern does not paint an accurate picture of who is in control at a given time. This is partly because price forms higher highs only to retreat and form lower lows. The fact that the consolidation tends to grow bigger only goes to affirm the indecisiveness in the market.
However, as soon as the price makes two higher highs and two lower lows, it is important to be extremely cautious as a breakout could occur at any given time. If the pattern occurs at the lower end of a long move to the downside, then the prospect of bouncing off a third lower low, moving up and breaking out above the upward ascending trend line is usually high.
This is why it is often referred to as a bullish reversal pattern, as it often results in price edging higher on volume once a break out of the upward trend line occurs.
Bottom line
While looking to trade the broadening bottom pattern, it is crucial to only eye long positions once the price breaks out of the upper trend line and holds. The perfect entry point will be when price breaks above the ascending trend line, which acts as resistance and hold as it signals bulls have overpowered bears and are likely to push prices higher.