Introduction
Double bottom chart patterns are technical analysis indicators that show a W-shaped change in price trends. It also offers a reversal of the price action due to the stock’s momentum or the forex-trading pair. In the W-shaped pattern, the low-price level is touched twice to form the upward breakout support level.
Eve and Adam
The Eve and Adam Double Bottom (EADB) is a double-bottom (W-shaped) downward volume pattern. It shows an upward breakout where the left rounded bottom is wider while the suitable base is narrow and V-shaped. It depicts a short-term bullish reversal pattern of the stock after it recovers from the downward trend.
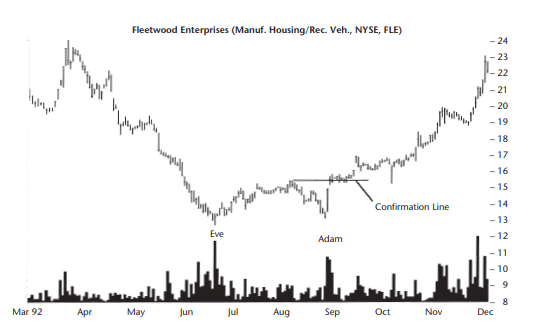
Figure 1: Eve and Adam Double pattern
In the Eve and Adam pattern, the eve bottom is wider than Adam’s bottom. The W-shape bottom is followed by the confirmation line to depict the upward breakout. In the chart above, prices decline until June, when the price hits $13 from the March highs of $24 until July (Eve). Volume increases and the stock prices move upwards before declining again in September. It retests the lows of $13 again before increasing in volume towards the end of the year. Afterward, it hits the previous high of $23.
At the confirmation point, the stock moves horizontally to confirm the breakout point for a short time (between September and October). The breakout point is at $15.5. The stock then moves above the breakout price to confirm the upward trend by almost 50%.
Identification
The Eve and Adam double bottom (EADB) is identified by first recognizing the W-shape combination in the stock price trendline.
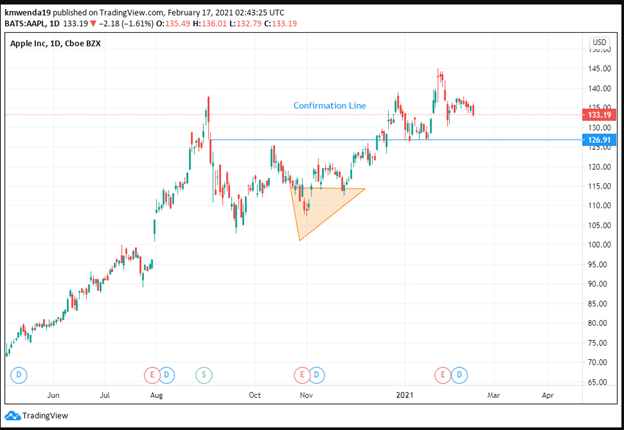
Figure 2: EADB-bottom appearance in the Apple Stock
In the Apple stock, the confirmation line formed at the $126.91 level in January 2021. It also began a new support level before moving upwards to $133.19 in February 2021.
The downward price motion comes to an end with the double bottom’s commencement- specifically the narrow right bottom (Adam). In case of a correction, the pattern rises after the downward trend as the stock seeks to confirm the new breakout point.
The two bottoms have to be different (the wide-rounded left and the narrow-V-shaped right). The left bottom can have short spikes bunched together. The right bottom has a long spike (mostly one-or-two days moving downwards).
The bottom prices may not be necessarily the same but may vary by 0-4%.
Peculiarities
A true EADB shows stock price movement above the confirmation price. The difference or variation between the bottom prices should be 4% at maximum levels. The pattern shows a reversal of the bear price downtrend. In a bull market, the average rise in prices is 35%, while in a bear market, it is 23%. This pattern is suitable for trading in a bull pattern.
It takes between 5 to 7 weeks to rise from the right bottom of the pattern to the breakout price, especially in a yearly position.
Trading recommendations
- Before trading, and as you observe the technical pattern, wait for the confirmation line to the first form above the double pattern. The breakout line and the confirmation point will take place above the highest point between the two bottoms.
- Trade the EADB in a bull market and establish the reversal upward break.
- Confirm if other similar stocks are climbing or moving in the same pattern. Check if they have double bottoms with reversal patterns indicating an uptrend.
- Trade when the breakout of the pattern nears the yearly (52-week) low.
- Pick the pattern whose left bottom is lower than the right bottom with a light/falling volume breakout.
Eve and Eve
The Eve and Eve double bottom (EEDB) pattern shows a W-shaped downward trendline where the two bottoms are broad and rounded. The pattern occurs in a short-term bullish reversal indicative of the upward breakout. The pattern works well when the emphasis is on the right bottom, i.e., lower and with a heavier volume than the left.
Traders will begin buying the stock when it reaches the lowest point. The price gains traction after enough buyers have hit the trade. The difference between the twin bottoms and the confirmation price is mostly 40%. For instance, in figure 3, the two bottoms settle at $9 before moving up to the confirmation line at $12. The difference between these two points is 33%.
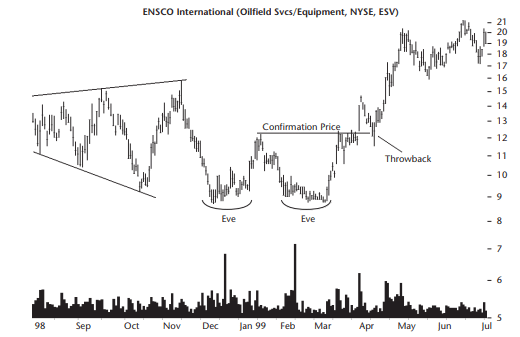
Figure 3: Eve and Eve Double bottom
Identification
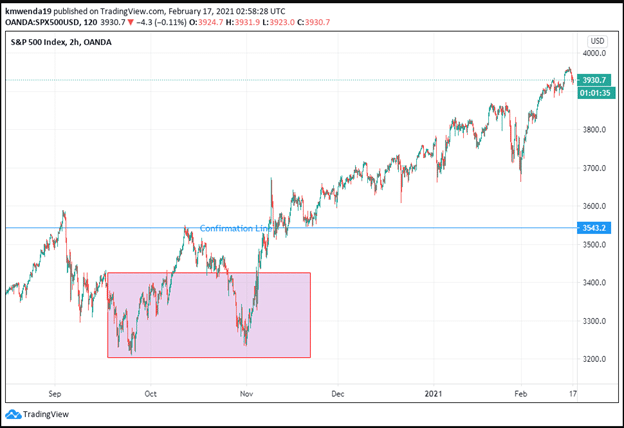
S&P 500 Index
The EEDB pattern forms between October and November 2020, slightly below $3,300. The confirmation line is at the $3,543.2 mark. The double bottom prepares the stock index to move in an upward breakout towards $3,930.7 by February 17, 2021.
Note that the stock bottoms out slightly below $3,300 before it begins the uptrend. While the left bottom is lower than the right, it can still work as long as the volume trend is higher towards the right than on the left. A better picture can be seen with the Dow Jones Industrial Average – stock index.
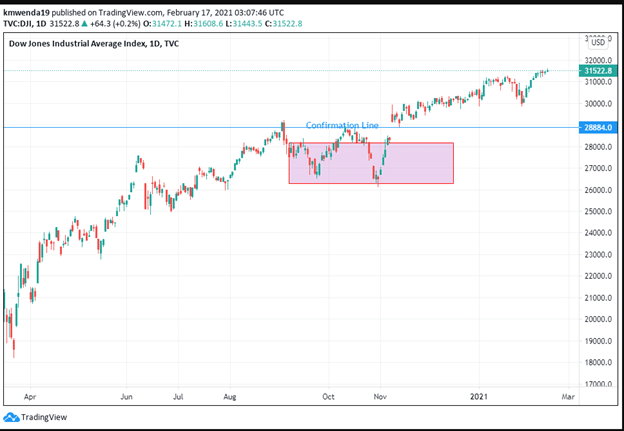
Dow Jones EEDB
Peculiarities
The EEDB is unique in a bull market, indicating upward breakout momentum. The falling trendline of the volume pattern shows a strong breakout of the price. If the right bottom is lower than the left bottom (compare DJI and the S&P 500 indices) above, then the marginal performance post-breakout will be higher.
Trading recommendations
- Identify the price target by adding the difference between the bottoms to the highest high, especially in a bull market.
- Wait for the price to rise slightly above the confirmation line after identifying where the EEDB pattern resides.
- Identify a bull market to operationalize the EEDB pattern.
- Confirm with related stocks.
Conclusion
This study shows how to identify double bottom patterns, particularly Eve/Adam and Eve/Eve. The patterns are different in terms of the shape of their bottoms. The patterns occur when a stock hits a short-term bullish reversal of the price trend. As a trader, you should identify the pattern to predict the stock movement after the breakout.
