A buyer and a seller are required for a trade to occur in the marketplace. When sellers are aggressive, and buyers feel that sellers are willing to accept a lower price, the price drops. All buyers and sellers are not created equal. Liquidity providers, for example, are compensated for buying and selling using limit orders. Some people trade to protect a position they have in another market. Some buyers and sellers are sure of the market’s direction, while others are not. Some will sell short in the hopes of buying back at a reduced price later, while others are unconcerned.
What is Volume Delta?
Volume Delta (VD) is one of the most helpful trading indicators when trading order flow. It provides a quick snapshot of a market’s buying and selling pressure. The difference between buying and selling power is known as Volume Delta. The difference between the volume traded at the offer price, and the volume traded at the bid price is used to calculate VD. When the delta is greater than zero, there is more buying pressure than selling pressure. When the delta is less than zero, there is more selling pressure than buying pressure.
What is CVD?
Cumulative Volume Delta takes the delta values for each bar and sums them together. The Cumulative Volume Delta assesses the effectiveness of buyers’ and sellers’ actions, or whether the volume generated by the buy and sell market orders has a price effect. When it does not move in the same direction as the trend, a divergence appears, which we can profit from.
While Volume Delta is good for comparing delta bars, Cumulative Volume Delta is more beneficial for evaluating buying or selling pressure at different price levels, such as swing highs or lows. When the high attained on security is higher than the price activity around it, a swing high (SH) is formed. A new swing high is formed when the price moves above a previous swing high and begins to retrace.
When the point reached is lower than the fluctuations around it, a swing low (SL) is formed. A new SL appears when the price falls below a previous SL and retraces. A market is regarded as an uptrend when price makes higher highs followed by higher lows. Conversely, the price makes lower lows in a downtrend followed by lower highs.
When price breaks a swing low, delta follows suit. This is because selling pressure is required to break a swing low, while buying pressure is needed to break a swing high.
Calculation
Transactions that occur on the ask are viewed as buying pressure and are added to the total, while those that appear on the bid are considered as selling pressure and are deducted from the total.
If we look at a particular interval;
CVD = difference between bid volume and ask volume.
How do you apply CVD?
Exhaustion
Exhaustion occurs when fewer buyers are willing to buy at new highs, and fewer sellers are willing to sell at new lows.
Bullish divergence
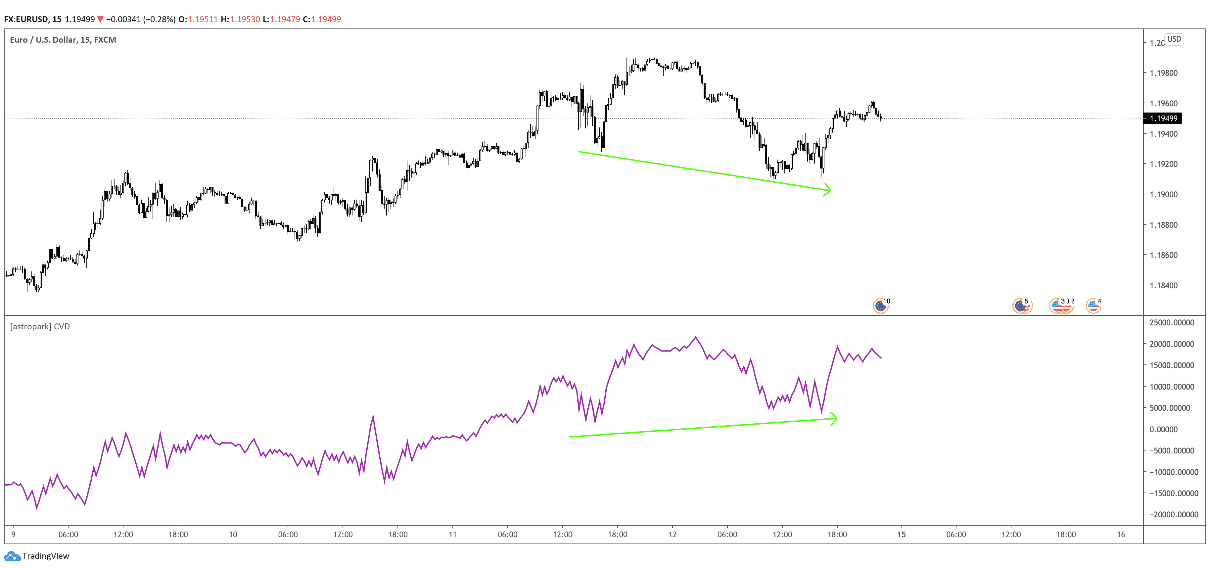
In the EURUSD image below, there is a bullish divergence. The price is making new lows while the CVD is making new highs as indicated by the green lines.

This shows that the sellers are not selling anymore, meaning they are exhausted. They begin to liquidate their positions; thus, the price rises. Consider entering immediately when the price starts going up, and the indicator is moving in tandem.
Bearish divergence
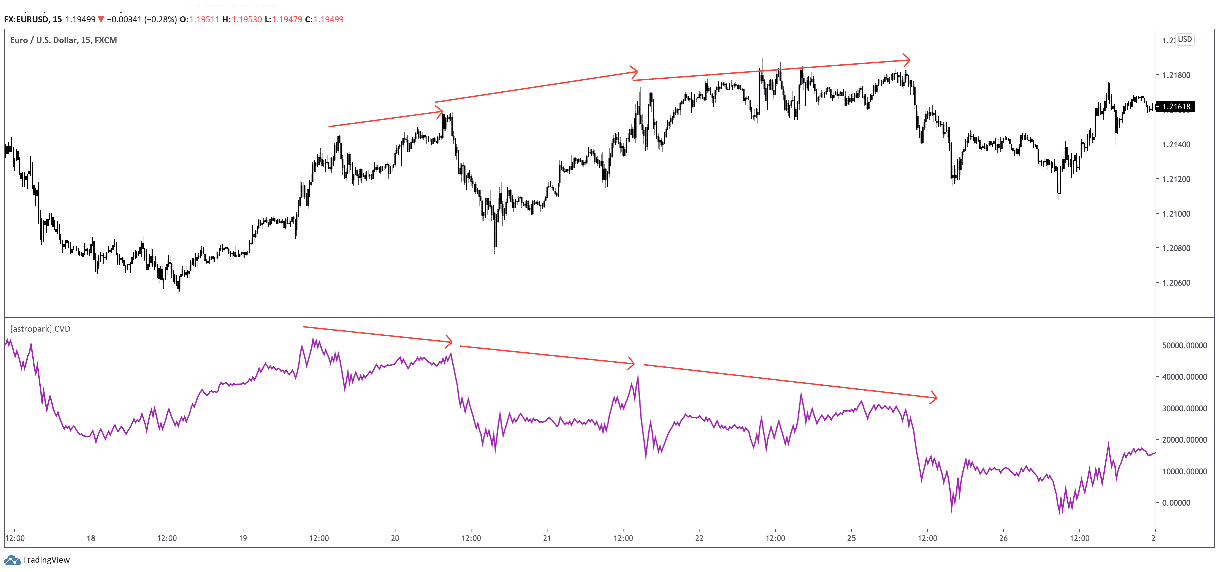
In the EURUSD chart below, there is a bearish divergence. The price is making new highs but the CVD is making new lows.

This shows that the buyers are exhausted and are not interested in buying anymore. As they begin to liquidate their positions, the price drops.
Absorption
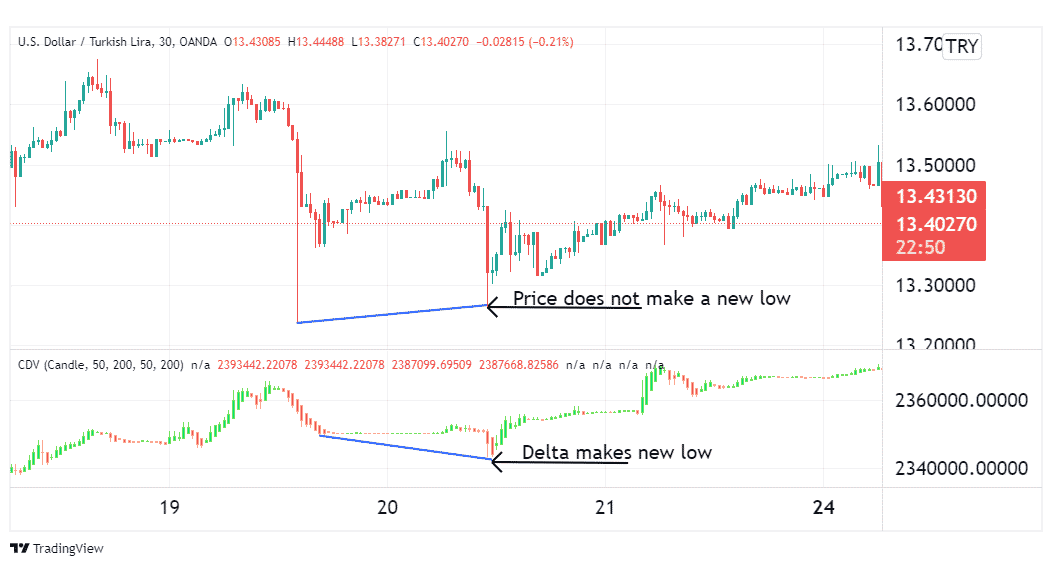
When aggressive buyers or sellers are unable to push prices to new highs or new lows, the market becomes volatile. We say the aggressive buying or selling pressure is being absorbed.

In the USDTRY chart above, CVD makes a new low, but the price doesn’t. This indicates aggressive selling pressure, but the buyers are absorbing that pressure. Thus, as sellers are overpowered, the uptrend starts.
Combining CVD with Stochastic
It is wise to combine CVD with other tools for better results. The best way is to trade it is with the trend.
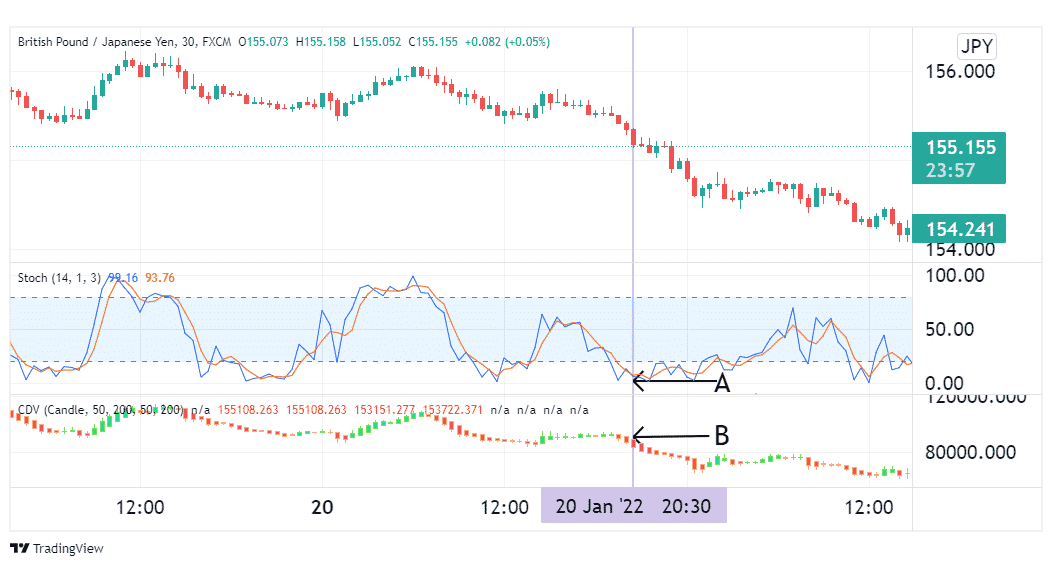
To generate a buy signal, ensure that the CVD is moving upwards and the Stochastic is in the oversold region, i.e., under 20. To create a sell signal, make sure the CVD is moving down, and the Stochastic is in the overbought territory, i.e., from 80 to 100.

In the GBPUSD illustration above, the Stochastic is at 4.21, showing that the market is oversold and the CVD is slopping down. This shows that there is a bearish trend coming up. So you can enter the sell signal at that point.
Summary
The CVD evaluates whether buyers’ and sellers’ actions are influential or have a price effect. It can help you manage open trades and spot significant reversals. Always be on the lookout for exhaustion and absorption, which indicate the possibility of a reversal. CVD can be combined with other tools to provide entry signals, such as Stochastic.
