The volatility indicator known as the Choppiness index (CI or CHOP) is a useful tool for determining whether the market is trending up or down or whether it is not trending in a particular direction (or a choppy market). In contrast to other indicators that reflect price movement, CI does not indicate a specific direction.
How the indicator works
As mentioned above, CI doesn’t tell us which way prices are going; rather, it tells us how fast they’re moving and if they’re going to continue to travel in one direction or another. Some technical indicators may be used in conjunction with CI to confirm any signals and accurately predict the direction of the price movement.
The CI may be used in a variety of ways by traders to identify whether or not the price movement is likely to continue to fluctuate.
CHOP index is an oscillator that ranges from 0 to 100. More stable or steady movements are indicated by higher values, whereas less stable or steady movements are indicated by lower values. The true range values for a predefined number of periods are utilized to generate the Index. Fibonacci ratios are commonly employed as a reading threshold for the CI indicator.
The Choppiness index has an upper threshold of 61.8 and a lower threshold of 38.2. Also, the middle point of the CI range and the blue line’s connection to that point, compared to the 50-point value, might be examined by traders.
The essential characteristics of the CI indicator on the trading platform are described below.
A CI rating below 38.2 indicates that the market is more likely to be going in a single direction, whilst reading over 62.8 indicates that the market is more inclined to move horizontally.
It’s common practice to look for prospective turning points in the price action, such as a breakout or a strong trend confirmation, around points 62.8 and 38.2. The breakout strategy is employed when the market conditions are choppy, whereas the trend-following method is employed when they are calm.
Trading methods based on CI
It’s best to buy or sell a breakout if the CI readings are exceptionally low or high.
The 38.2 percent retracement of the CI is often considered to be a threshold at which to buy or sell an asset. However, there is a lot more to the signal than this, so let’s take a closer look.

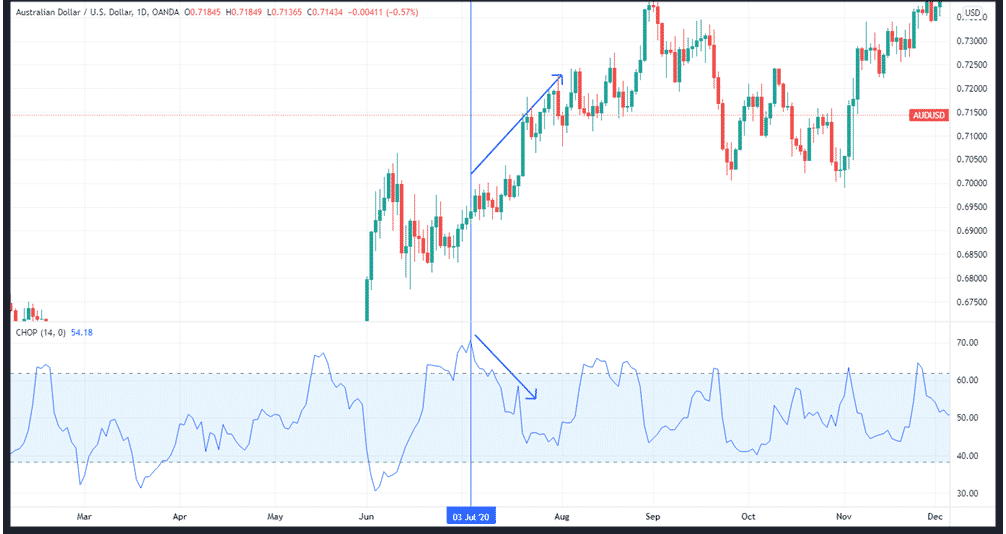
Look at the AUDUSD chart above. If the pair continues to increase over the 61.8 percent threshold for an extended period of time, you may infer that the market is in decline. When prices fall below the 61.8 percent level, it will be an early warning that an uptrend is just beginning.
Tracking the market’s current trends
As long as it remains below the 38.2 barrier, CI indicates a significant directional movement in the market. As long as the oscillator is below 62.8, a common strategy is to take positions in the direction of the trend. If the consolidation continues for a long time, there will be a trending phase. In addition, a long-term trend implies that consolidation is on the horizon.
The 38.2 level is the ideal starting point for both bullish and bearish trend-following bets. Three successive tests of the 62.8 level have long been considered a warning to stop trend following positions.
Breakout trading
When the CI is constantly above the 62.8 level during periods of strong turbulent market activity, patience is required when using the indicator as a trading tool. When the price falls below the Fibonacci level, it is an early indicator of a trend reversal and the beginning of a new trend.

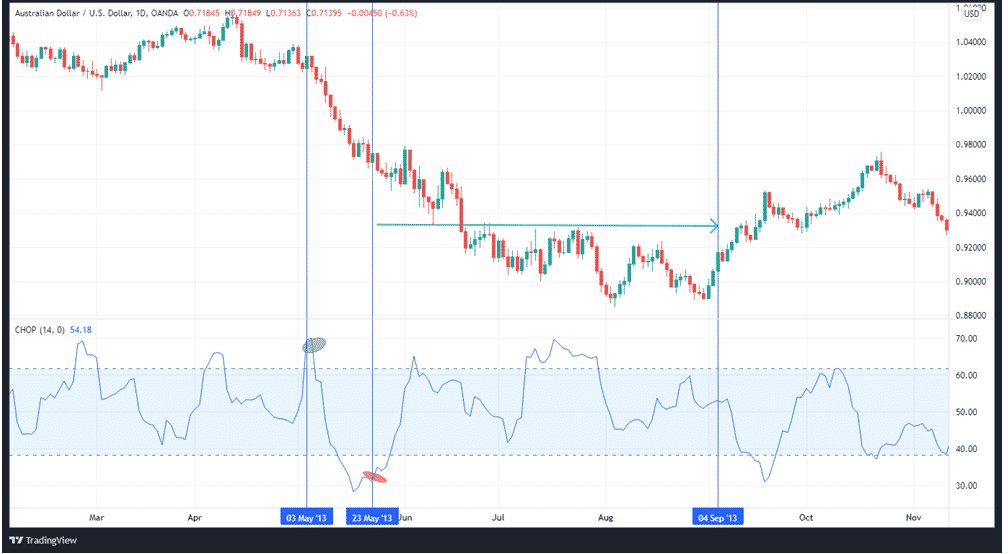
It is highly recommended to maintain breakout trend positions if the CI falls below 38.2. To prevent making losses, you should exit the transaction as soon as the index reaches 62.8 again. When the price falls below 62.8, the trend changes from one of sideways movement to one of downward movement. Observe how the price choppiness changes as it exceeds the 38.2 thresholds shown in red in the chart above.
The RSI, ADX, and the Choppiness Index
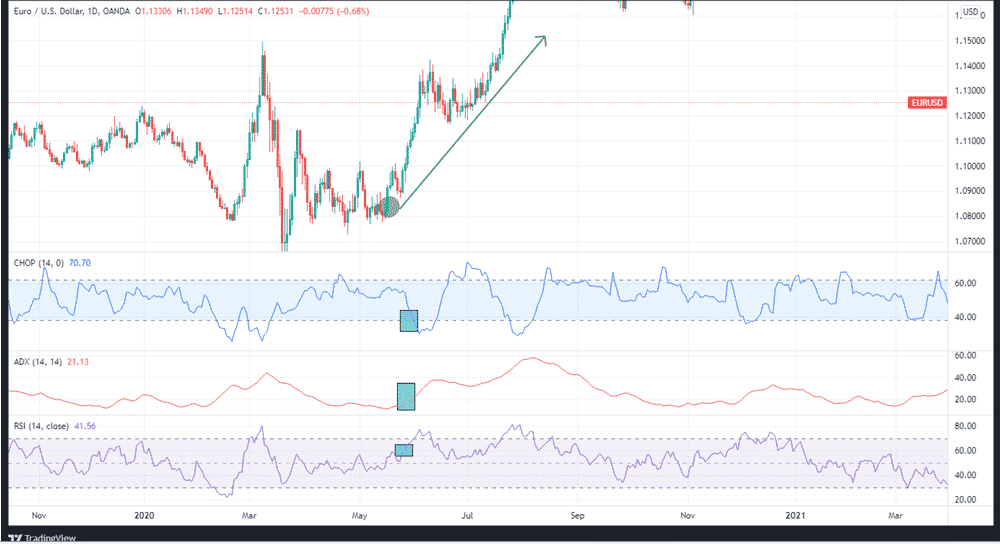
The RSI, the CI, and the ADX are utilized to provide a buy or sell signal.
These requirements must be satisfied in order for the signal to work:
- The CI reading falls below the 38.2 threshold in the CI calculation.
- In addition, ADX passes the 20-point barrier from below it.
- The Relative Strength Index (RSI) is more than 60.

A strong upswing can be seen in the chart above when RSI, ADX, and CI all cross the threshold levels set forth above.
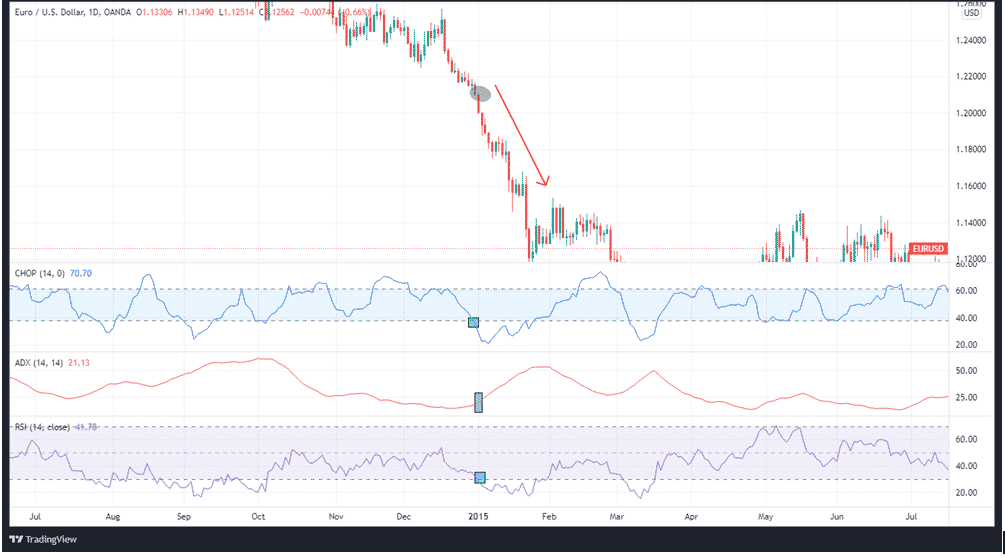
The following are the conditions for a buy signal:
- The CI should close below the lower threshold of 38.2.
- There should be an ADX reading above 20.
- There should be an RSI of at least 40.

A significant downturn can be seen in the chart above, when RSI, ADX, and CI all exceed the threshold levels set out above.
In summary
The Choppiness Index is a handy measure for assessing the range of a trend’s fluctuations. Its operation is governed by a fundamental set of principles, and its application is similarly straightforward. Nevertheless, by using the CI only it’s impossible to predict whether a trend will continue or come to an end. A breakout or continuation of a trend is indicated by the CI’s sensitivity to price movement.
