
Identify a trend, stick with it, and you are sure to make a fortune in the forex market. That is a common saying that has stood the test of time in the highly competitive marketplace. Aroon is a commonly used technical analysis tool that allows people to ascertain the strength and direction of the underlying trend of currency pairs.
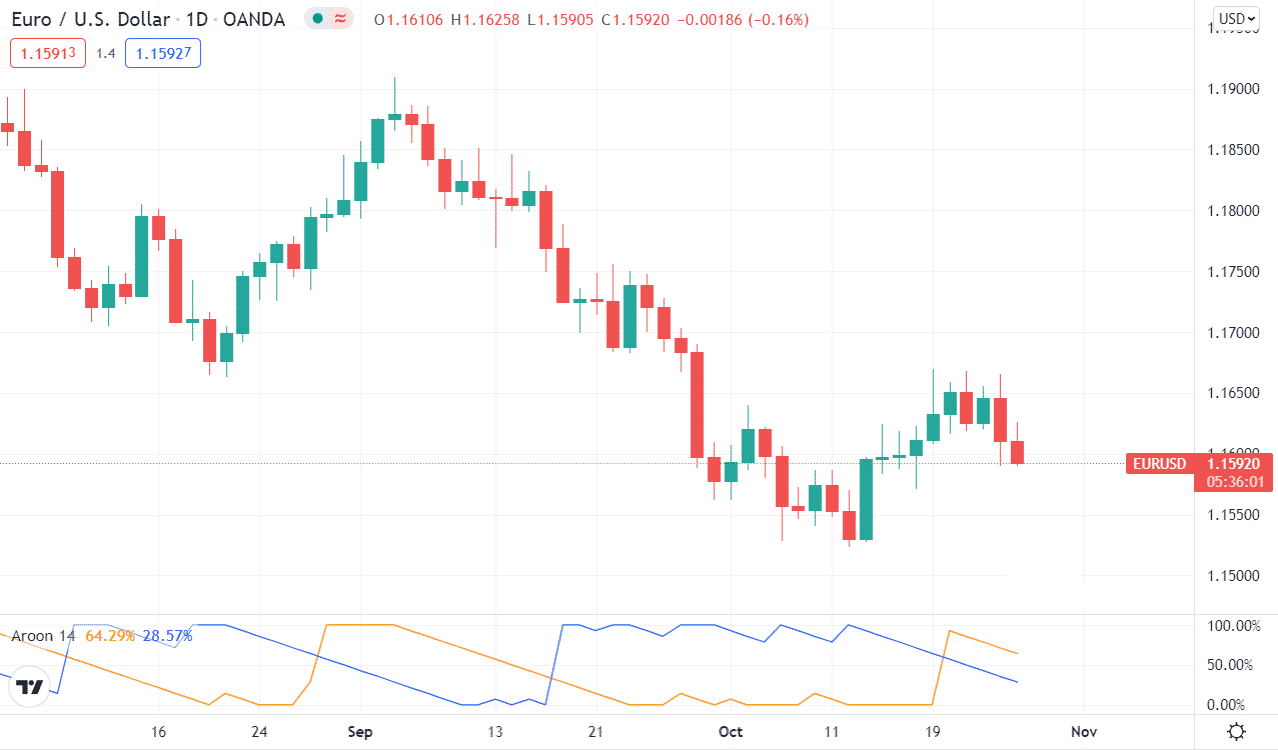
Developed in 1995, it has proved to be a highly effective tool for affirming whether a currency pair is moving up or down and the strength of the momentum. It stands out partly because it focuses on time relative to price.
The fact that it can help detect when a trend is starting also allows people to get into trades early, thus standing a chance of making a significant profit on price changes. Additionally, its ability to signal potential price reversal also makes it ideal for profiting from changes in the underlying trends or exit before things change.
In addition, it can be used to locate periods of consolidation while trading currency pairs, thus making it easy to deploy appropriate range trading strategies. Its ability to measure how long it’s been before price touched a high or low means it can be used on any time frame, thus ideal for long term and short term trading strategies.
Features
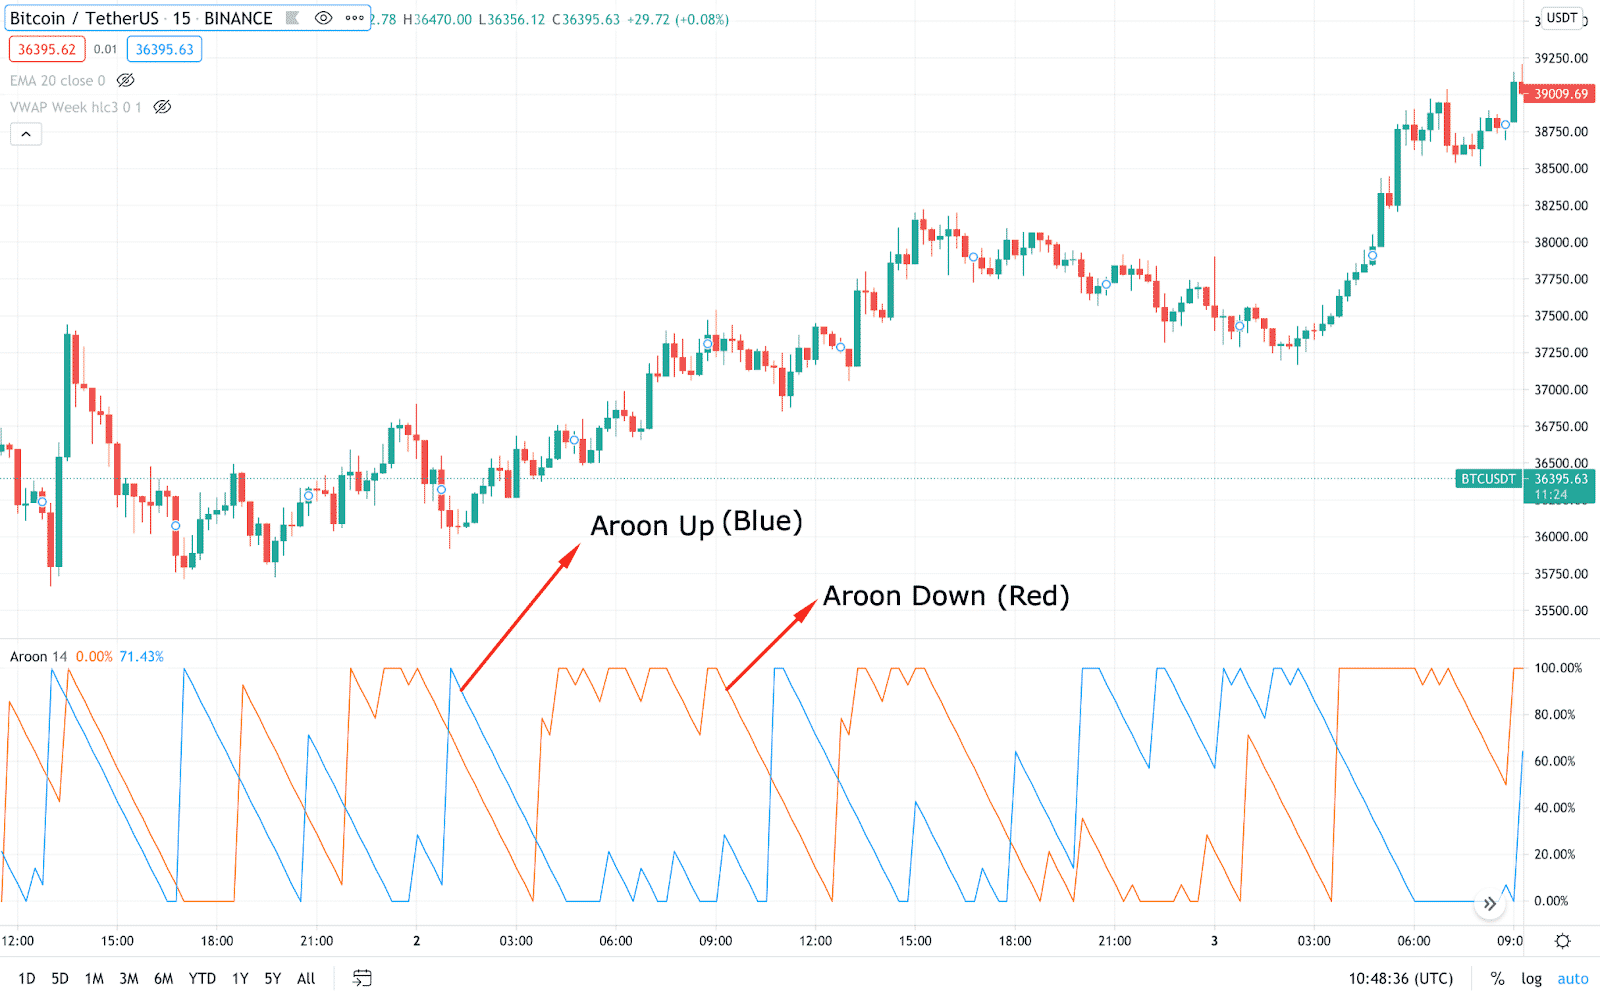
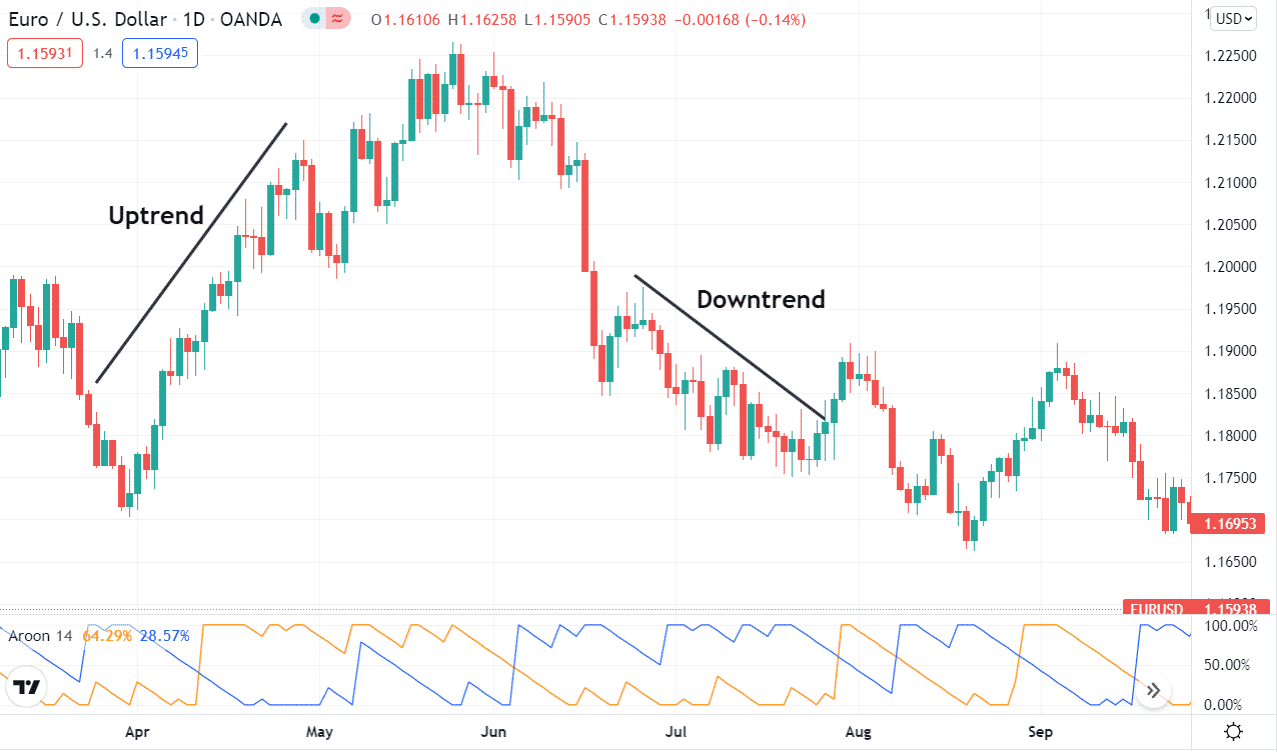
It is made up of two components.
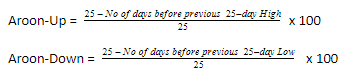
Aroon-Up: commonly used to measure how long it’s taken before a currency pair achieved a 25 day high.
Aroon-down: measures how long it’s taken before a 25 day low was recorded.
Both are expressed in percentage with readings of between 0 and 100. Additionally, both are plotted side by side, thus making the interpretation much easier.
Calculating the Aroon indicator up and down readings is as easy as tracking the number of days it has taken before the price peaked or reached a 25 day low. Once the highs and lows for the last 25 periods are tracked, it becomes easy to know how long it has taken to hit the high and the low.
The numbers are then used on the indicator as follows
Interpreting the readings
While the final reading is interpreted as a percentage from 0 to 100%, the higher the value, the stronger the underlying trend and the likelihood of it holding much longer. The smaller the reading, the weaker the trend and the need to be extremely cautious, especially when deploying trend-following strategies.
Example
For instance, if it took two days for a price of a currency pair to reach a 25 day high, it means
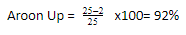
This means that price is likely to continue making higher highs as the upward momentum is strong enough and bulls are in firm control. The same will be true in a downtrend if it takes two days for the price to reach a new 25 day low. In this case, the price is likely to continue edging lower given the strength of the downward momentum.
In addition to the up and down readings, it is also important to pay close watch to the crossovers generated by the indicator. Consequently, whenever it crosses the up line and down line, the same can be used to signal it’s time to enter or exit trades.
Therefore, one can look to enter long positions whenever the Aroon-up crosses above the Aroon -down, signaling upward momentum, as the price is likely to continue trending up. Similarly, one can eye short positions whenever the Aroon-down crosses the Aroon-up and starts moving lower, signaling building up downward momentum, affirming that price is likely to continue edging lower.
Whenever the Aroon up and down readings are below 50, the same signal price is in consolidation mode without any clear trend. In this case, one can look to deploy range-bound strategies as the price is likely to oscillate between support and resistance levels. In addition, one can put the asset on a watchlist, waiting for a potential breakout from the consolidation phase.
What to remember
The indicator is mainly made up of three readings. An asset understudy is said to be in an uptrend whenever Aroon up is above 70, and Aroon down is below 30. The setup signals the upward momentum is building up and that bulls are in control; consequently, price should continue printing higher highs.
The reverse is also true where market bearishness is signified by the Aroon down reading being above 70 and Aroon up below 30 as well. In this case, the downward momentum is also gathering steam with bears in control. Consequently, prices often end up generating lower lows as short-sellers enter short positions.
The tool signifies the start of a new trend whenever the Aroon Up crosses above the Aroon Down. Such a setup affirms that new highs are likely to become more frequent than new lows. Similarly, whenever the Aroon up moves above 50 and Aroon down below 50, signaling upward building momentum. Additionally, when the up reading nears 100 and the down reading remains below 30, it implies a strong uptrend.
Consolidations
The prospects of the market remaining in consolidation occur when both the Aroon readings are below 50. Additionally, when both Aroon up and down are moving lower in parallel, the same would imply a lack of clear direction
Limitations
One of the biggest drawbacks of the indicator is that it can give awkward signals during periods of extreme volatility. Rapid changes in prices will often result in the tool also whipsawing back and forth. Additionally, there will be periods when it will provide valuable signals but too late to use on price moving significantly in a given direction.
Consequently, the indicator works best when used to complement other trading tools and is fundamental to get accurate signals.