Volatility is a critical part of Forex, and quantifying it is done effectively with standard deviation. This is useful as traders get to spot the right revenue opportunities. However, only swing traders and those who prefer high-risk trades find volatile markets interesting.
For long-term traders, a less volatile indicator is preferred as the volatility can hide the subtle but important trends. The finest fact about this tool is that understanding it is easy as it is a good reflector of the market condition and indicates shifts from active conditions to sluggish state and vice versa.
But, the effectiveness of using this indicator relies on how well you employ it. Here is a meticulous analysis of this beneficial indicator.
Understanding standard deviation
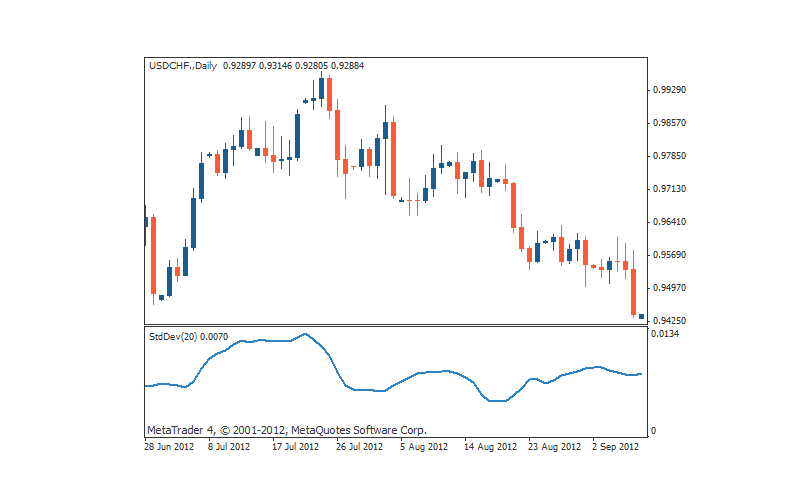
As a tool for assessing the difference in the mean and actual closing rates, standard deviation (SD) aids in spotting current changes in rates, so a proper assessment of an asset’s risk or volatility is possible, while future volatility is also evaluated using SD. The tool is usually found near the bottom part of a chart that is in a line design. A default setup period of 14 or 20 is usually done based on the platform used.
Implications of findings
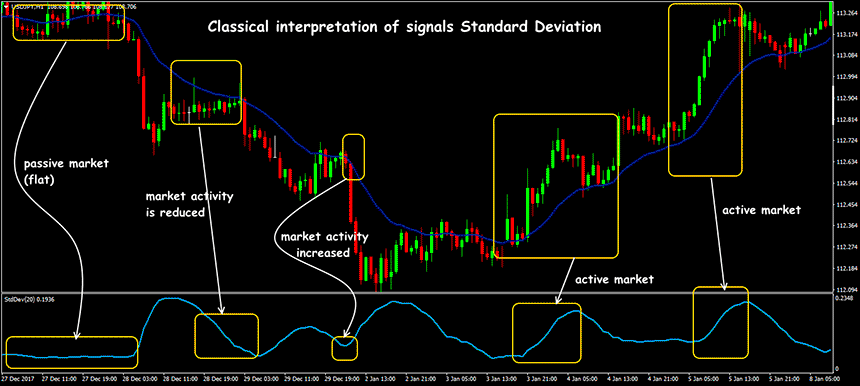
When the SD is high, it implies that the real rate is far away from the mean value. This points to increased volatility. Reduced volatility is detected when the two rates are closer together. This situation leads to the market turning into a flat one.
How standard deviation is calculated
To evaluate the SD, you have to first identify the following:
- Mean closing value for the default setting of 20 periods.
- Find every period’s deviation by deducting the mean price from the closing value.
- Identify each deviation’s square value.
The next step is adding the resulting square value of all deviations and dividing them by the deviations present. From the resulting value, identify the square root to get the SD value.
Determining Volatility
The value of SD depends on the asset involved. A high SD does not link to the volatility condition. Instead, it is linked to the value of the asset. So, a high valued asset is not to be taken as having increased volatility.
How to Use the Standard Deviation Indicator in Trading
The usage of SD in Forex depends on the trader. While some use it in conjunction with other tools, some use it as the only tool. Regardless of these facts, it helps in the simultaneous evaluation of various facets of a rate and validates possible signals. It is also possible to use it alongside volume, momentum, or trend tools.
Bollinger bands have SD as a prominent component to spot the lower and higher bands. The usage of SD becomes crucial when there is a breakout you want to capitalize on or when you wish to validate reversal in rates. To decipher the signals, the volatility of the rate plays a critical role.
So, a low SD value signifies low volatility or an inactive market. This can lead to a price surge or breakout. In the case of high SD value, the volatility of the market will be high with reduced market activity. Spotting of signals is done in another easy way by identifying the volatility and associated high and low-price levels. The signals given below are spotted after the levels are recognized.

1. Bullish Market
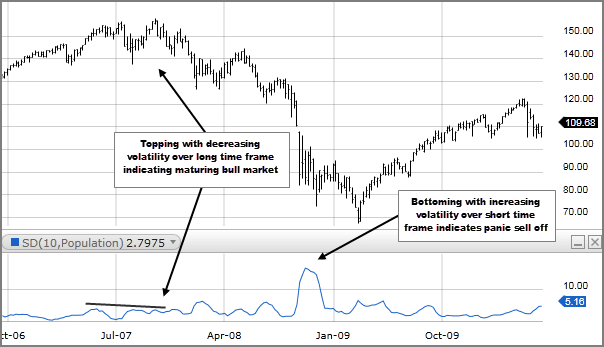
Reduced volatility is present with market highs. This is possible with time frames of longer duration and when you spot the high rates high and low volatility simultaneously.

2. Vacillating Market
In an escalating volatile situation where you spot market highs and high volatility for the short-term, the situation implies that traders are undecided.
3. Waning Interest

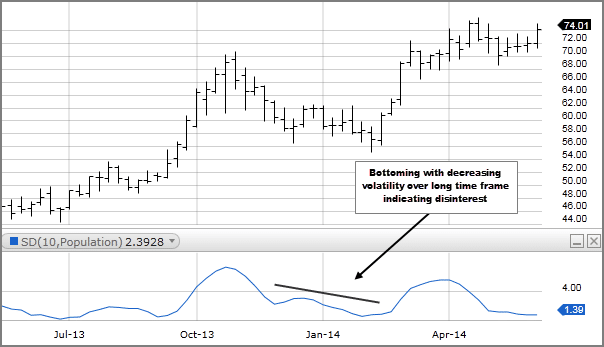
When the market lows are seen with reducing volatility over a longer span, the situation is indicative of waning interest in a particular asset.
4. Panic Selling
An increasingly volatile state with market lows over a shorter span is indicative of panicked selling.
From the above signals, you can understand that the spotting of decline and cresting of rates is essential to recognize the reversal of price towards the average point. The SD is useful for placing stops and restricting your risk exposure. But, keep in mind that opening trades carry a certain amount of peril.
Benefits of Standard Deviation
Multiple benefits are possible with standard deviation application in Forex:
- You can select the crucial market highs or lows. In other words, you can spot rates that are very volatile and have increased too far a distance from the average rate.
- Deciding entry points inside a trend is easier. For instance, when the rate surges too far from the average point, the rates can return to the mean eventually. In the case of a stronger trend, an entry at the mean point can be contemplated.
- When only a narrow window of the rate change is present and a high SD forces rates from the mean point, trading with the breakout will bring you good profits.
Summary
Standard deviation is a simple but effective indicator to anticipate volatility and its upward surge or decline. It is tremendously useful to spot flat and active market conditions. For successful trades, it is not only pertinent that you spot the direction of a trend, but also the entry you make.
By using the right risk/reward format and leveraging volatility, you can get excellent outcomes. To enable this, a solid understanding of SD is required. This will help you tackle volatility efficiently. Controlling and turning it into an advantage is easier by utilizing SD.
However, keep in mind that this tool should only be applied after a meticulous analysis of price distribution, its range, and the trend over a longer span. This will ensure positive outcomes whenever you use the tool. It is mostly reliable but only when the conditions are conducive. For instance, in a trending market with a moderate volatility level, when the price range is focused on the range’s middle part, it is ideal to use SD.
