Chart patterns are at the heart of all technical analyses that take place in the forex market. They stand out as they make it easy to understand market sentiments and overall mood while analyzing an asset. Pennants are unique as they allow market players to discover ideal opportunities and on the risk-reward frontier.
Understanding pennants
Pennants come into play whenever there is a significant jump in an asset price under study. After a strong movement, the price often pauses as exhaustion kicks in, resulting in oscillation in a tight range in the form of a pennant.
The pause that usually comes into play could be a result of people locking in profits. In addition, it could be as a result of the price hitting a strong support or resistance level. Whenever the consolidation is in play, more buyers or sellers would often join the fray.
The breakout that comes into play is usually in the direction of the underlying trend. For instance, if the price was in an uptrend, it is common for the price to continue moving up once the consolidation phase is over.
Similarly, suppose the price was moving lower. In that case, it is common for the price to edge lower from the continuation pattern once short sellers pile sufficient pressure.
How to trade pennants
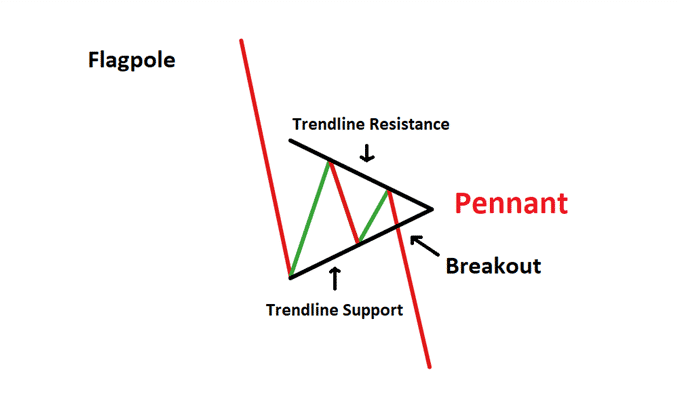
A bearish pennant comes into play whenever the price drops significantly. After a steep drop, sellers often close their positions to lock in profits. The result is usually a pattern whereby price oscillates in a small triangle-like pattern.

Given that price often struggles to move up even on short-sellers closing their positions, it increases the prospects of a move lower. Consequently, such a structure presents an opportunity to open a sell position.
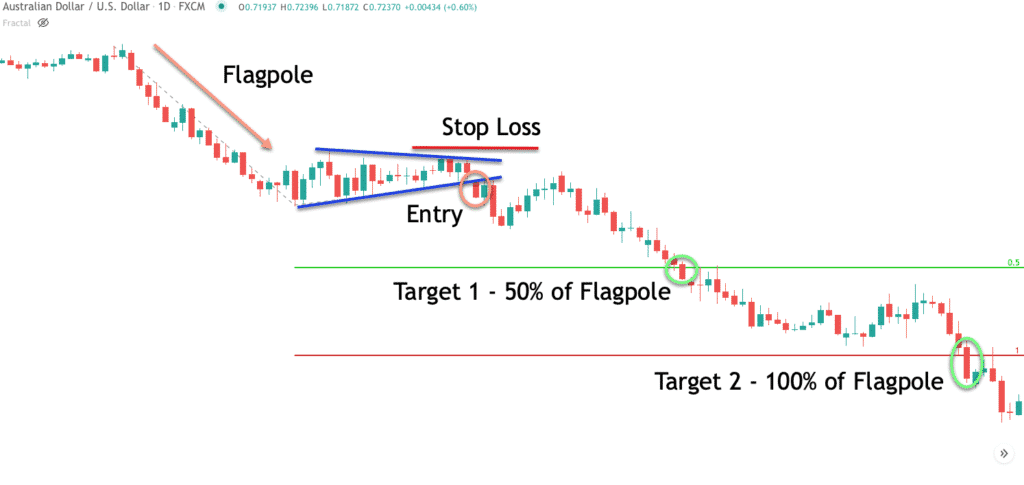
The chart below shows AUDUSD edging lower, after which consolidation kicks in, resulting in the pair oscillating in a tight trading range resembling a symmetrical triangle.

After a short period, the price broke out of the lower rising trend line signaling a buildup of bearish pressure. While bulls did come into the fold, as shown by the small bull candlestick on price pulling back to the lower trendline, the strong selling pressure ensured price edged lower. The formation of a strong bearish candlestick below the support line of the pennant affirms price is poised to edge lower.
Consequently, while trading such patterns, it is important to wait for the price to break below the lowest trend line of the pennant pattern. Once a pullback fails to hold, one should look to enter a sell position as the price will often continue edging lower.
Once price breaks out of the pennant formation, the move lower is usually almost the height of the previous leg lower before the pennant formed. Such patterns often result in much stronger moves to the downside after the breakout.
Taking profit
The profit target is measured from the price breaking out of the lower trendline, which initially acted as support. In this case, it should be the same height as the initial flagpole formed on price moving lower before consolidation kicked in.
Stop loss order setup
The stop loss order, on the other hand, can be placed a few pips above the trendline in the pennant formation that acted as resistance, curtailing any upward movement during consolidation.
Trading bullish pennant
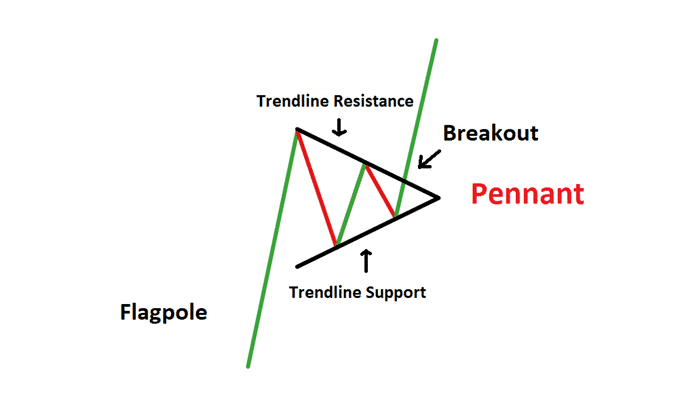
A bullish pennant comes into play whenever price moves up significantly, after which exhaustion kicks in, resulting in price oscillating in a small symmetrical triangle. The exhaustion may come into play on buyers closing down positions to lock profits or price hitting a crucial resistance level.

However, given that price oscillates in a small symmetrical triangle affirms that bulls are still in control. Consequently, the prospect of price breaking out and moving higher after some time is usually high.
A confirmation that the price is set to continue moving higher comes into play whenever it breaks out of the trendline resistance level and closes above, shrugging off any potential pullback.
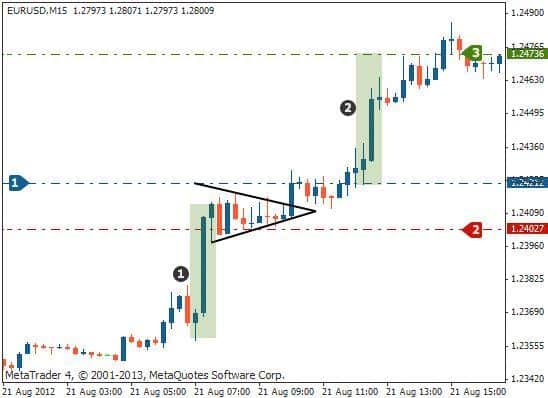
The chart below shows EURUSD’s strong movement on the upside, after which exhaustion kicked in, and the price started trading in a range in the form of a pennant.

The sharp rise, in this case, is the pennant pole affirming a buildup in upward momentum. The pole, in this case, signals the start of an uptrend, and its size is important as it is often used to calculate the profit target.
The fact that the triangular pattern is small indicates that bears don’t have any chance and that bulls are still in control despite rejection at a resistance label.
Traders should look to open buy positions once the price moves above the descending trend line, which acts as a resistance. However, it is important to wait and see how bears react and try to engineer a move lower. If price struggles to retreat back to the triangular formation, then it means buying pressure is significant, and that price is likely to continue moving up.
Consequently, one can trigger a buy position as soon as bears fail to push the price lower following the breakout.
Profit target
The profit target, in this case, can be measured as the height of the initial leg higher before the price entered into a triangular consolidation. Consequently, the price target should be the same height as the initial swing, measured from the breakout point.
In the chart above, the profit target is at point 3, which is the distance from point 1, where the initial breakout candlestick closed. The target is the same height as the initial pennant pole height.
Stop loss
The stop loss can be placed a few pips from where one enters the long position. Additionally, it can be placed slightly above the initial resistance, which in this case acts as support.
Bottom line
A pennant is a unique chart pattern for anyone looking to profit whenever exhaustion kicks in after a strong price action in a given direction. In this case, positions should be opened, taking into consideration the direction the market was initially moving.
