
Pipe top pattern is a two-spike formation that occurs at the top (or in an uptrend) of a trading chart signaling a bearish reversal. It is common in weekly charts, although it can still take place in daily and monthly charts. However, for best performance, look for it in weekly chart analysis.
Pipes warn the trader of an impending change in trend. It first begins with a green bar which is followed by a red bar. The price moves downwards after the red bar begins to show, indicating a bearish reversal. A good understanding of this occurrence will help the trader learn where to short the stock for maximum returns.
Identification
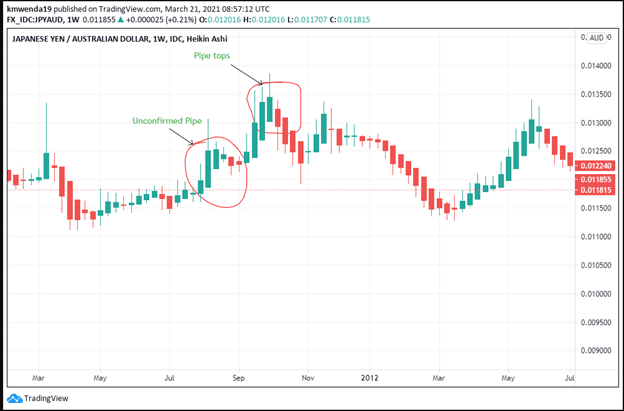
Figure 1: Japanese yen/ Australian dollar
The left pipe (marked unconfirmed) is formed from an uptrend in prices. It helps to consolidate the price trend making a new high that rises until the pipe top is formed – rising green bar and falling red bar.
1. Pipes are spotted in weekly charts
Pipe tops are spotted easily in weekly analysis charts. These pipes are adjacent to each other higher above the surrounding pipes. They may be taller than other pipes in an annual analysis. The twin-like bars can be of a similar length or may differ slightly (as seen in figure 1). However, the large overlap ensures that their length difference or height is not significant.
2. Little variation in price
The difference between the two peaks (of the green and red bars) should not be greater than an average of $0.64 or a median range of $0.35. This feature ensures the twin bars have common prices that are above other pipes in an annual price trend analysis.
3. Upward retrace
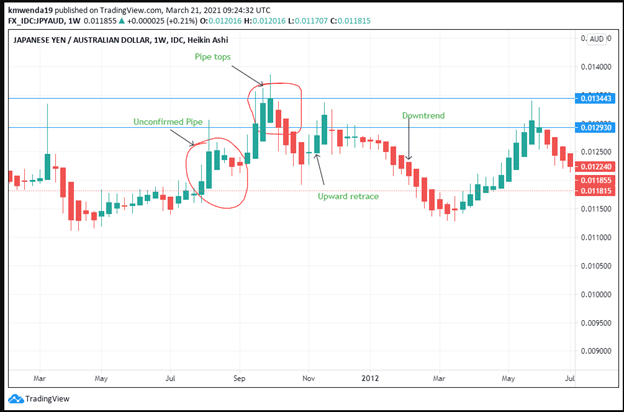
Figure 2: Upward Retracement before a downtrend
After confirming the pipe top, the price tends to form an upward retracement as it proceeds to a downtrend (see figure 2). The retracement does not rise higher than the two spikes. It remains within the range as the downtrend follows from January 2012 to April 2012. The spikes are unusually tall as compared to other price trends, thus, helping in the price confirmation.
4. Confirmation of the price
A look at the pipe top shows that the prices have closed below the lowest low in the red bar as it proceeds on a downtrend before forming the retracement. The price close helps us to ascertain that the pipe is indeed an authentic pipe top. Prices proceed below 0.012930 for more than three months before they begin to rise later on in the year.
The trader needs to wait for the prices to confirm below the lowest low in the second red pipe. Trading should not be done in the unconfirmed pipe where the prices are higher than the lowest low. Further, the pipe top appears after a short retracement in the downtrend. It is important to wait for the downward breakout before initiating the trade.
Trading strategies
Here is a compilation of the top five strategies to follow with the pipe tops, which you can combine at your convenience.
1) Computation
The measure rule is also applicable in setting the price target using the pipe tops. Get the highest position in the pipe top and subtract it with the lowest low to get the height of the formation. Then subtract this height from the breakout price (which is the lowest low in this scenario). Identify the price target by getting this computation. It can be extrapolated both in a bear as well as a bull market.
2) Watch the downtrend
Pipes that appear in downtrends give a perfect picture of the price formation. Take necessary caution as you trade with the prior price trend. Further, prices will be determined by an analysis of the upward retracement. After the retracement, a pipe appears as it directs the further decrease in prices. The trader will wait to see where the prices are declining and short the stock.
3) Do not trade at the end of the downtrend
If you wait for the pipe to show after a long downtrend, you may make a wrong judgment, especially if you want to short the stock. The pipe may signal a bullish reversal.
Watch for the pipe top to form after a long-term uptrend. In most cases, the pipe ushers in a bearish reversal after the uptrend. The uptrend may take months or even a year. Watch for any signs of premature pipes as they may prompt a rushed trade.
4) Retracement of the uptrend
Understand that the pipe tops give way to a temporary period of market weakness. After forming the second (red) bar, prices may continue to decrease for about a month or two before they begin the uptrend (upward retracement). The difference is not significant, but the trader can still initiate a short bullish position.
5) Stop loss
It is essential to make use of the stop-loss option as you trade using the pipe tops. The stop loss should be placed at least 10 to 20 pips from the trade position. Take note that the pipe top can appear at the end of the upward retracement and rise by 35%. It can then fall by 15% depending on market dynamics. If you are planning to sell (short) the stock, place the stop loss slightly below the breakout point. Imagine a decline of at least 15%.
Conclusion
A pipe top pattern ushers in a bearish reversal after a prior bullish uptrend in price. There are two retracement periods on both sides of the pipe top. The left side has a downward retracement, while the right has an upward retracement. The upward retracement is mostly followed by a bearish continuation after the pipe top is confirmed. The trader should be careful to trade after confirming the breakout position. Further, pipe tops are common in weekly charts. The trader can also spot them in daily or monthly charts. However, weekly charts present the best trading pattern for the pipe tops in terms of predictability.