Introduction
You probably wouldn’t board a flight if you weren’t certain it is the right one to take you where you need to be. Simultaneously, you have to plan a suitable airport to disembark to reach your destination in the shortest time possible. The same applies to forex trading. A great amount of effort goes into determining the right moment to enter the market and exiting at the right moment to take maximum profits or lessen the size of losses.
Determining market entry and exit points comprise taking a hard look at price charts and having a firm grasp on the fundamentals. The market analysis seeks to provide answers to three questions: what is the potential entry point in a rising/falling forex market trend, what entry or exit signals are chart patterns giving, and when is the right time to take profits on a winning trade or to exit a losing position?
Here is how to determine entry and exit points
Consider the forex entry and exit points as the points of embarkation and disembarkation in your destination journey. You probably have to rely on a map or GPS to find your optimum airport. In forex, the price chart and fundamentals are your GPS.
Determining entry points
- Track trends
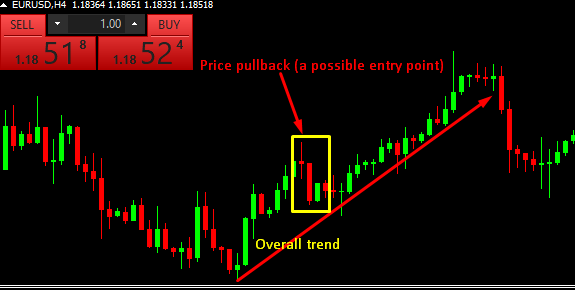
Price action usually follows a certain trend, whether going up or declining. But this trend is never linear because markets often correct higher or lower. Often, the market resumes its march following the overall trend. Having identified the trend, a possible approach you could take is to identify price pullbacks to use them as entry points.

- Leverage support and resistance levels
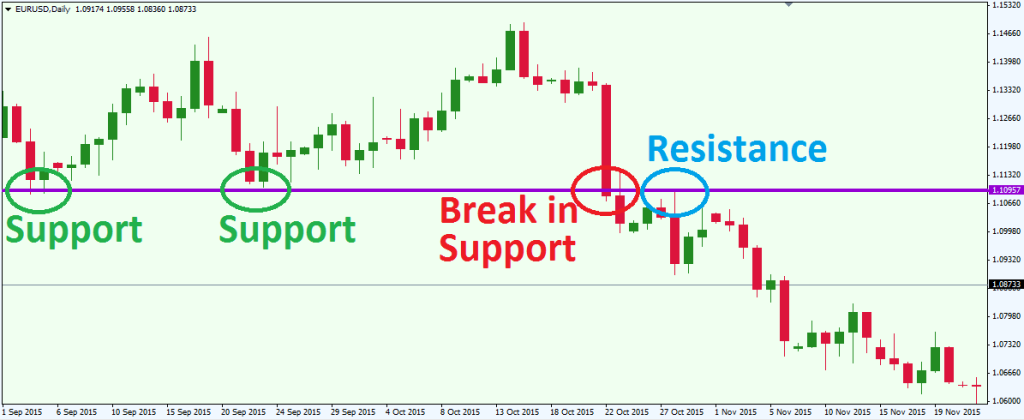
Besides price pullbacks, levels of support and resistance are also potential points of entry into the market. Typically, support is the price, at which point an uptrending market regains momentum to track the overall trend. The price provides emotional support, especially if it stays strong despite various attempts by market corrections. On the other hand, the resistance level is the price point that a down-trending market fails to break above despite several tries.

Not all direction changes are mere corrections. Sometimes the market turns in the opposite direction, and it breaks below the support level, as shown in the figure above. If you were watching such a price chart, then the “break in support” point is a potential market entry point.
- Trade volume
Volume is a great signal provider when looking for entry points, although it is traditionally ideal for trade confirmation. Indicators such as on-balance volume (OBV) notify the trader when the market is experiencing overwhelming buying/selling pressures. You can throw in a few other indicators for more confidence in the signal provided.
- Candlestick patterns
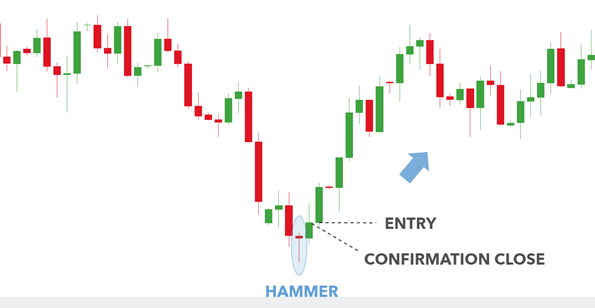
Candlestick charts are popular for a reason. The patterns that the candles create are useful when looking for entry signals. A great pattern that traders often rely on is the hammer candlestick pattern shown in the figure below.

- Continuation patterns
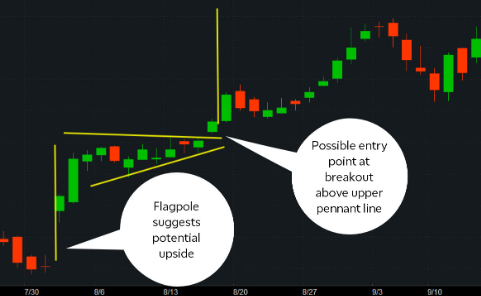
It is another useful candlestick pattern that helps to find entry points. Some examples of such patterns include pennants, triangles, and flags. Pennants, for instance, form when an uptrending market takes a break, and then it regains momentum upwards. The figure below shows a bullish pennant.

Determining exit points
Knowing when to take profits or cut losses is equally critical in forex. Here are a few pointers:
- Trendlines also show possible exit points
Trendlines are great indicators of entry points, but they can also point to the right spot to exit the market. If, for instance, the market closes closer to or just below the support level, then you might begin thinking about quitting the position because this move suggests that the price movement is losing momentum and that it could turn opposite soon.
- Continuation patterns
A continuation pattern like pennants can equally be leveraged to find exit points. You probably could determine an exit point in the figure above by adding the flagpole length to the breakout point. As usual, you need additional indicators to confirm the resulting signal.
- Use trailing stop-loss orders
A trailing stop-loss order ensures that a position locks in maximum profits. This order acts automatically such that you do not lose a penny from the trade. A stop loss is always beneath the prevailing bid price on a short position but above the overall asking price on an extended part. Such orders have a predetermined execution price, which differs from the market price by a constant range.
- Use take profit orders.
Take profit orders are limit orders specifying a particular price at which you exit a winning position. Such orders are ideal exit strategies, especially if you are a short-term trader, but they are also useful in a volatile market. You identify the preferred exit price in advance with market analysis, which is always above the prevailing asking price if in an extended position.
- Perfect market timing techniques
Successful traders have a risk-reward mechanism they use to enter and exit markets. It includes creating and sticking to holding periods, which could be the next resistance/support level. Alternatively, you could find a target price before even entering a position such that the moment the market touches the price, you close all active positions.
Conclusion
A trading strategy is not successful until it increases your account’s size, meaning it must win you some good returns. In other words, a great strategy must include not only a great entry point but also a great exit point. Finding potential entry points requires preparation and the ability to read and understand price charts. Some tricks include tracking the trend while watching out for price pullbacks, trading volume, and studying candlestick patterns.
Most of the tricks used to identify entry points are also useful when looking for exit points. For instance, some pullbacks have significant momentum meaning you should view them as a signal to quit active positions. Overall, traders should develop and stick to risk-reward techniques to guide them regarding entering/exit a position.
