The Hull Moving Average (HMA) is an indicator created by Alan Hull. He described it as a Moving Average that is sensitive to current price behavior but also capable of maintaining curve smoothness. According to Hull, this indicator nearly completely removes latency while simultaneously improving smoothness.
Using the HMA, traders may see which way the market is trending in one direction or another. Using recent price activity, HMA determines whether the market state is bullish or bearish in relation to historical data. As the price activity changes, the indicator responds accordingly while keeping the curve smooth.
While the Exponential Moving Average (EMA) and Simple Moving Average are also trend indicators, the HMA has a unique attribute. Its goal is to make those more responsive than EMA and SMA by delivering a quicker signal. The hull indicator has a considerably better tracking relationship with price than the other two MAs. That’s why there’s no “lag” when using it.
Moving Average weights are used to calculate the HMA. Price changes in the most recent past are given precedence over those from a farther past. As a result, a dynamic yet smooth Moving Average is created, which can be used to spot the market’s dominant pattern. Additionally, some traders find the indicator useful in timing their entries and exits.
When looking at the Hull, you’ll notice that it has two dimensions: positional value and directional value, which are generated from the current slope direction.
HMA formula
Finding the indicator’s value is simple. However, one has to learn about Weighted Moving Average (WMA) before we can apply it effectively. Follow these procedures to calculate the HMA:
- Calculate the WMA over a period of n/2, then multiply the result by 2.
- In the following step 2, you’ll compute the WMA for period “n” and subtract it from the value you obtained in step 1 above.
- Using the data from Step 2, compute the WMA with a period equal to the square root of “n.”
The HMA formula is as follows:
HMA = WMA(2*WMA(n/2) − WMA(n)),sqrt(n))
HMA in action
To get the most out of this technical indicator, you’ll want to make sure your settings are correct. One of the critical things that you must get right is the number of periods.
The HMA has a default period of 14. You may, of course, make changes to this to suit your own trading needs and objectives. Using a demo account several times will help you find the ideal time frame for your needs. When trading, we recommend using periods of 15 and 25.

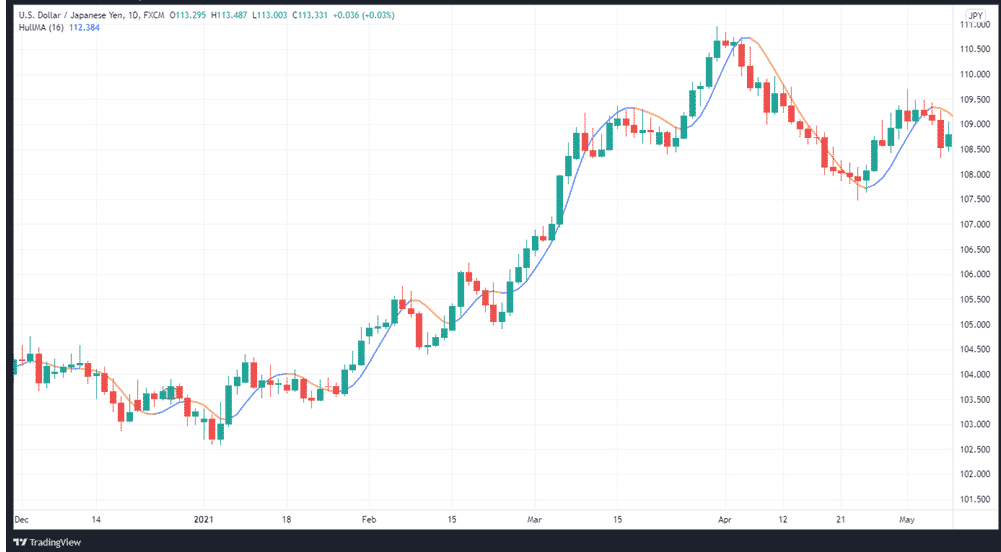
The blue color indicates an upward slope of the HMA, whereas the orange color indicates a downward slope. This is, therefore, a two-way representation of whether a market is bullish or bearish.
How the indicator works
The usage of an HMA with a longer time period can help uncover trends. If the HMA is rising, the overall trend is positive, which suggests that long positions may be more advantageous. As long as the HMA is falling, the overall trend is declining, making it a good time to open short positions.
It’s important to keep in mind the following primary signals about the indicator:
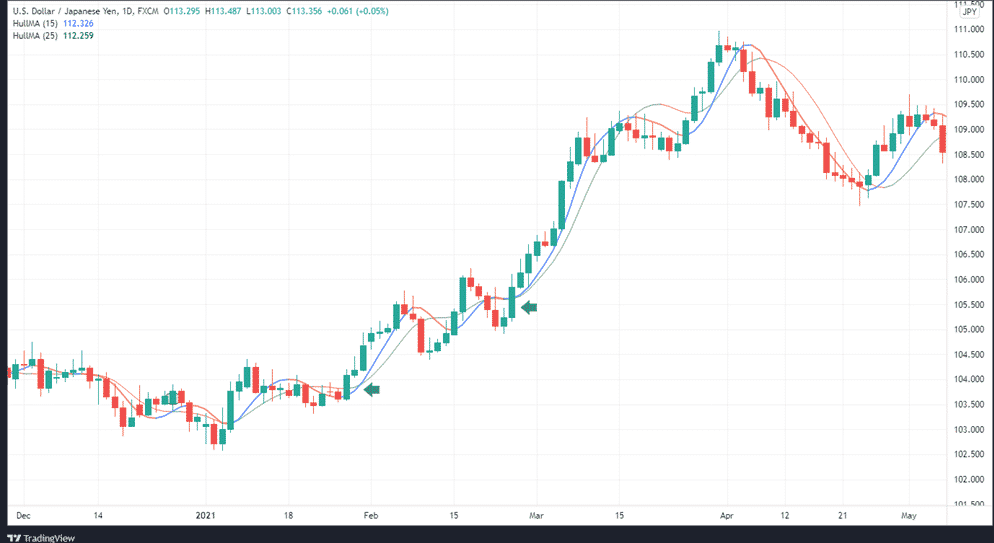
- The buy signal is sent when the fast-moving HMA goes above the slower HMA
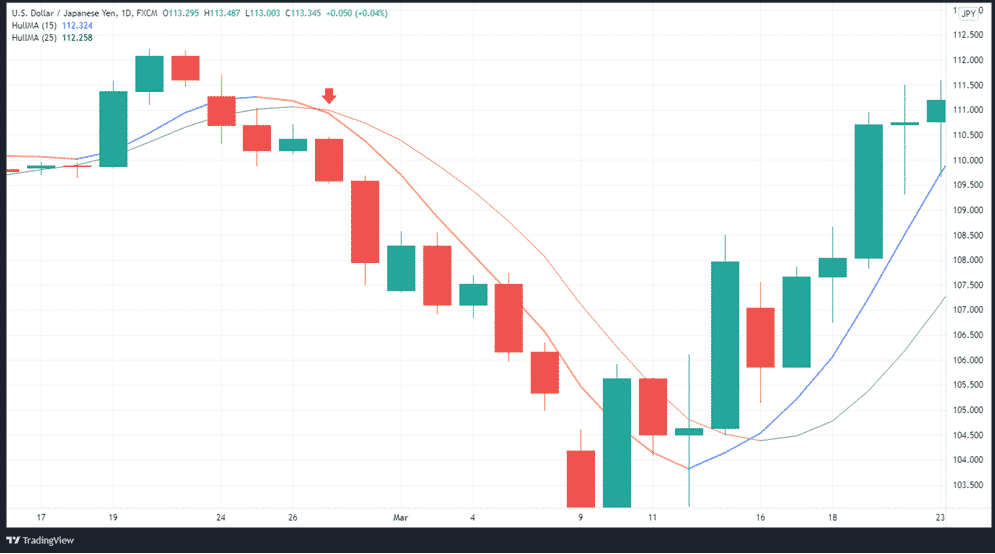
- Selling is indicated when the quicker HMA goes s below, the slower one
That’s all there is to it. This is a very straightforward method, yet it’s highly effective.
Take profit
To determine where to put your “take profit” level, you can do the following:
- Either wait for the HMAs to re-cross in the opposite direction, or
- Use the next established support and resistance levels after the crossover to locate your take profit.
- Use a trailing stop to give you greater flexibility as the market changes its momentum and trajectory.
Using the HMA crossover approach, the following example shows a buy signal. In the chart below, the green arrow points to the appropriate buy position, where the faster HMA crosses the slower HMA in a down-up direction.

Below is an example of a Hull Moving Averages crossover strategy sell signal. The red arrow points to the appropriate sell position, where the faster HMA crosses slower HMA in an up-down direction.

If you want to enter the market in the direction of the current trend, you can utilize a shorter period HMA. To enter long, you need to ensure that the HMA is rising. On the other hand, a short entry is sent when the HMA is falling.
In summary
HMA is a well-rounded tool that can be very effective for day trading. In terms of Moving Averages, the HMA stands head and shoulders above EMA and SMA because of its ability to respond quicker with minimal noise. Its increased responsiveness, on the other hand, could be a double-edged sword. It has the advantage of spotting trends more quickly, but the downside is that it is more susceptible to wild swings in price than other Moving Averages.
