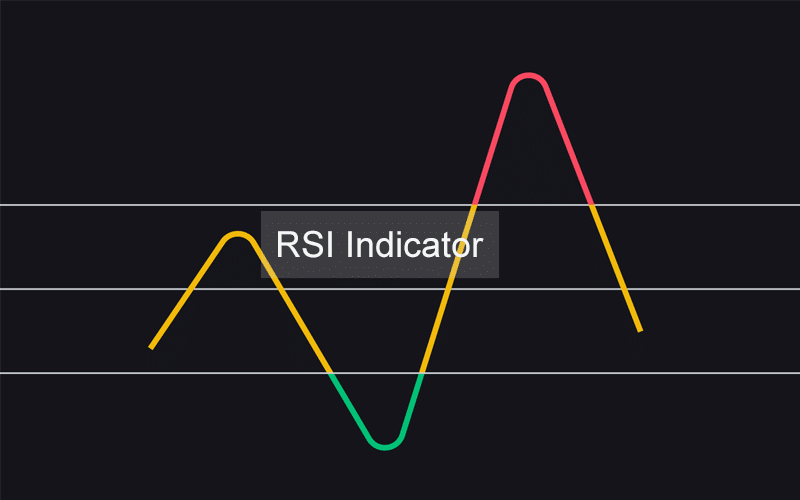
RSI Indicator – the calculation and purpose. Why use RSI?
Price fluctuations consistently change the speed (momentum) due to the intensity of traders’ decisions. RSI helps us to quantify that momentum and generate trading signals.
The calculation of RSI consists of two parts.

Here we calculate the ratio of gains to losses over a specified period, usually 14. We use a positive value for the Average loss in this formula.
When there are enough periods (usually 14) of data available, we can calculate the value of RSI. The purpose of this part of the formula is to smoothen the results.

The story behind the “time-proof” status
RSI is one of the classic indicators that are still popular nowadays due to its efficiency and simplicity. The author of RSI is J. Welles Wilder – a prominent name in the technical analysis. Wilder published his famous book “New Concepts in Technical Trading Systems” in 1978. In the book, he introduced RSI and many other technical indicators that are included today in the majority of charting software packages worldwide. Initially, the RSI indicator was intended to be used in stock trading. As traders have found value in it, they started using the indicator for other assets too.
In 2017 RSI was tested by Patrice Marek and Blanka Sediva from the University of West Bohemia. Through daily optimizations, randomized in time testing and over 10,000 simulations, the researchers found, that RSI can still deliver good profits. Although, over the long run, a simple buy-and-hold strategy still outperforms.
RSI and market conditions
Born for the range markets
When the market is in a range, the average price changes decreases. In this market environment, we can see big price changes as “not normal”, therefore the logic behind trading in the range is to spot these “abnormalities” and mitigate them by taking positions in the opposite directions of the unusual moves.
As the calculation of RSI is based on the comparison of the recent paces of the price change, the indicator can effectively detect the increases in the price changes and generate entry signals. This quality of RSI fits well with the logic of trading within the range, where significant price changes are not natural.
The market is dynamic, so the instruments are. Every instrument has its volatility qualities. Sometimes for highly volatile instruments following the readings of 20 and 80 (instead of 30 and 70) of RSI will be more appropriate.
RSI during trends
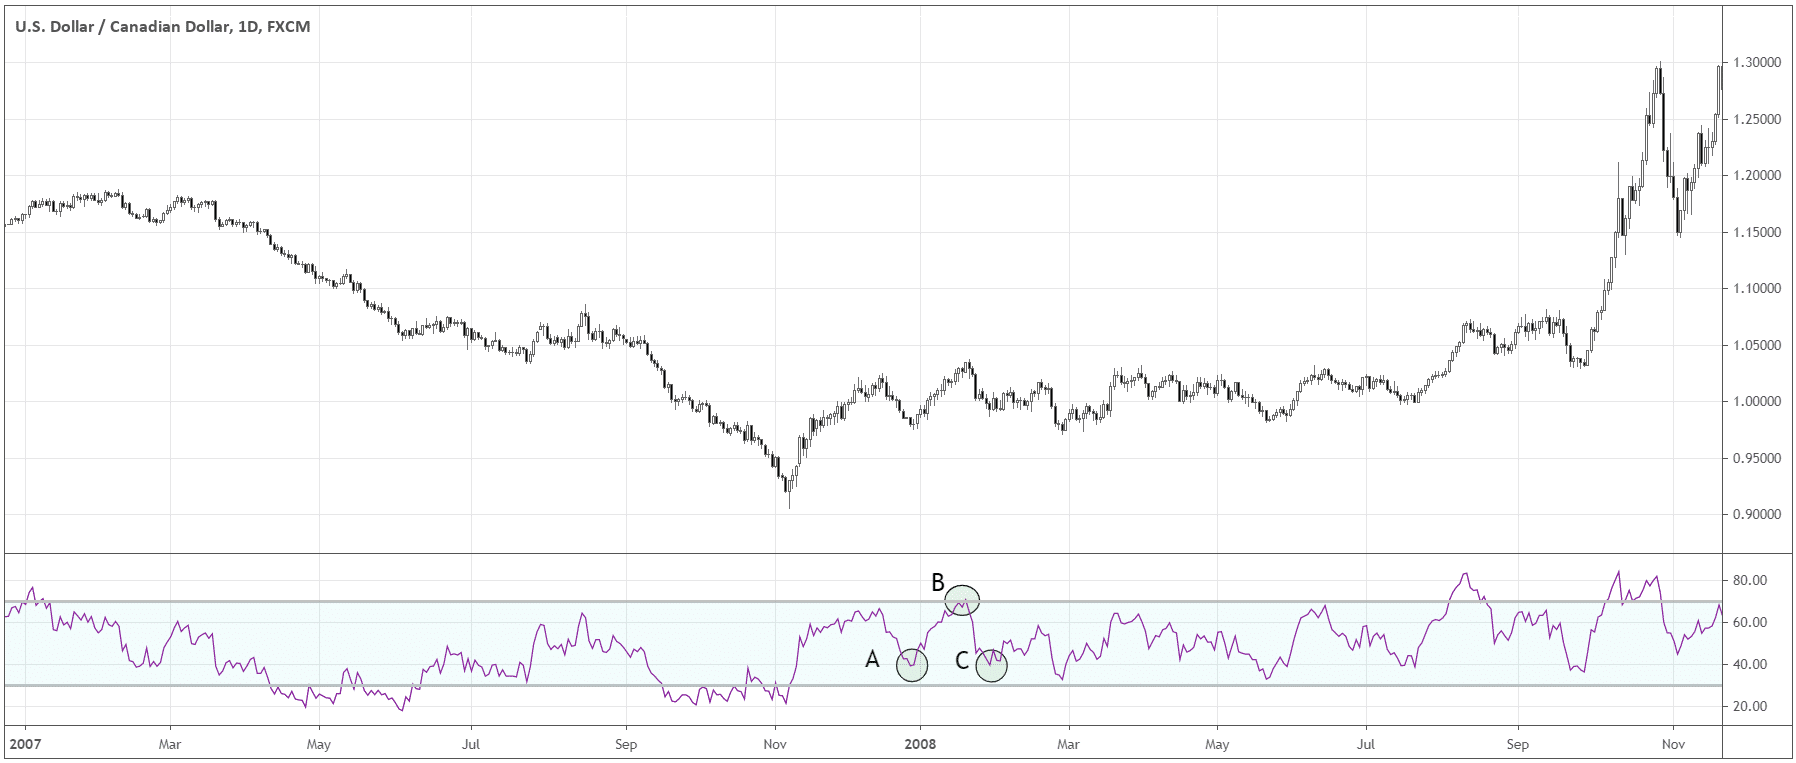
Usage of RSI during the trend can help a trader to identify the first signs of fading momentum of the trend. In uptrends, RSI would usually stay above 30 and often reach 70. That’s a sign of the strength of the trend – the upswings are consistently more powerful then pullbacks. Conversely, in a downtrend, RSI should often hit 30 but usually stay below 70.
If we notice that during the uptrend, RSI consistently struggles to hit 70 and even manages to reach 30, then the trend is weakening. In other words, the power of the upswings decreases, hinting that more sellers are coming to the market.
The opposite is true for downtrends – if RSI is unable to reach 30 over several attempts (see “A” and “C” in the chart below) and can even touch 70(“B”), that’s the signal of more buyers coming to the market.

Basic RSI trading setups
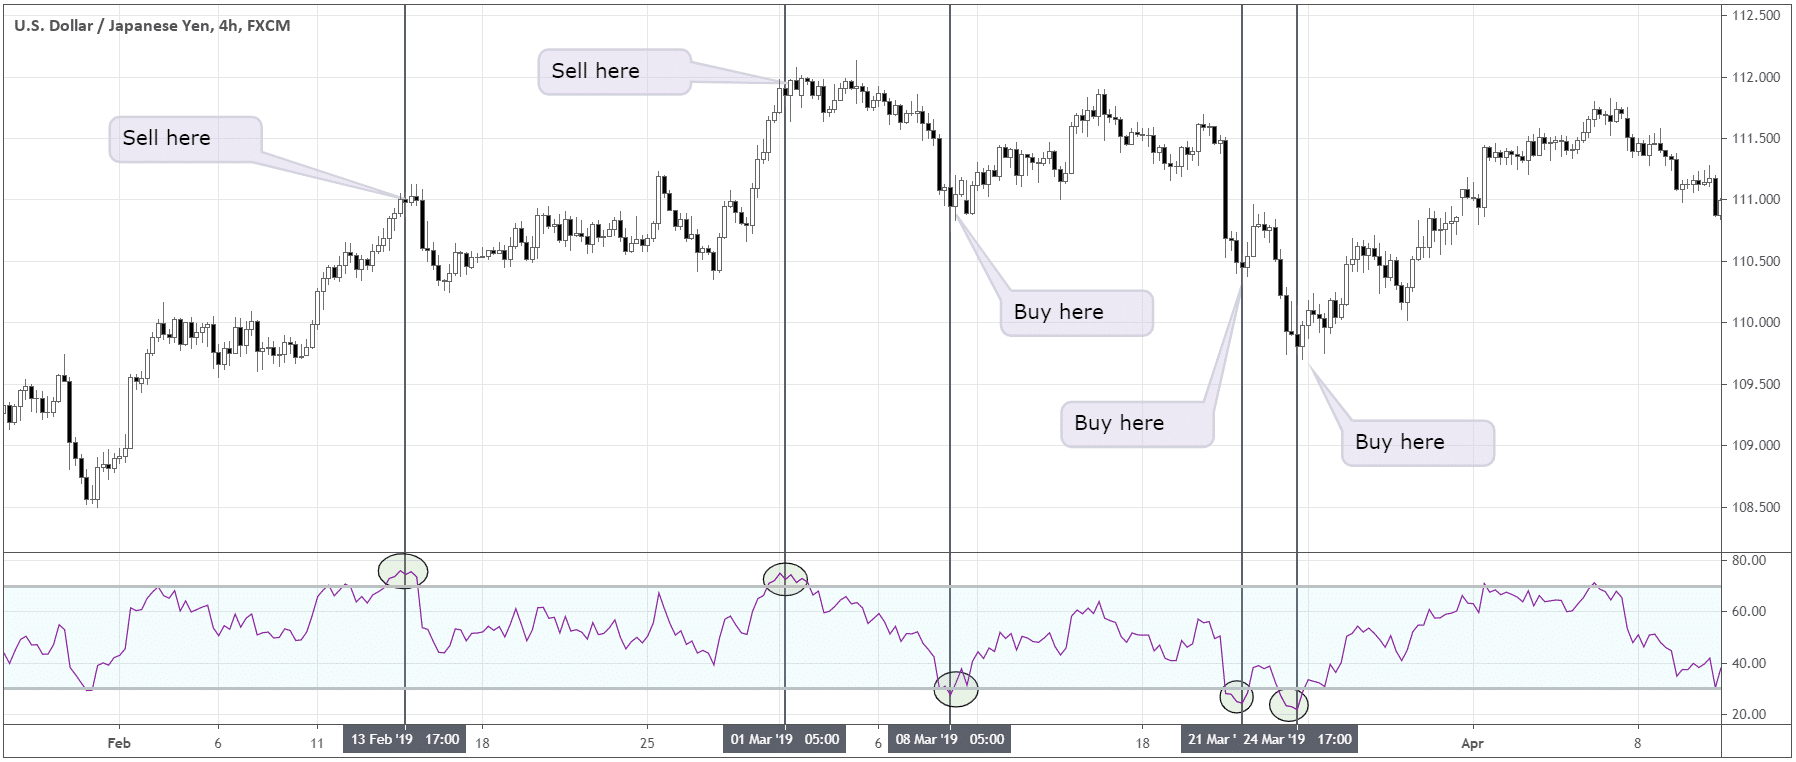
A classic bullish setup in RSI would come up when RSI reaches a horizontal 30 reference level, preferably while the market is in the range state. Conversely, we will get a bearish signal when RSI reaches the horizontal 70 reference level. For more volatile instruments we may use 20 and 80 horizontal levels instead of 30 and 70, to avoid false signals caused by market noise. Let’s look at the possible trading signals generated by RSI in the chart below.

RSI Divergence
Another kind of RSI old school setup is the divergence of RSI with a price. Imagine, you’ve been watching an instrument trending for a while, you don’t want to join the trend because your gut tells you the correction or even reversal is near. The feature of the majority of reversal setups is that contrary to common bias, they form for a while. Trends rarely reverse in a steep “V”- manner, as it takes a lot of counterforces to stop an established trend and even change it. That’s where RSI can help us. RSI is useful when there is more of the past price action data.
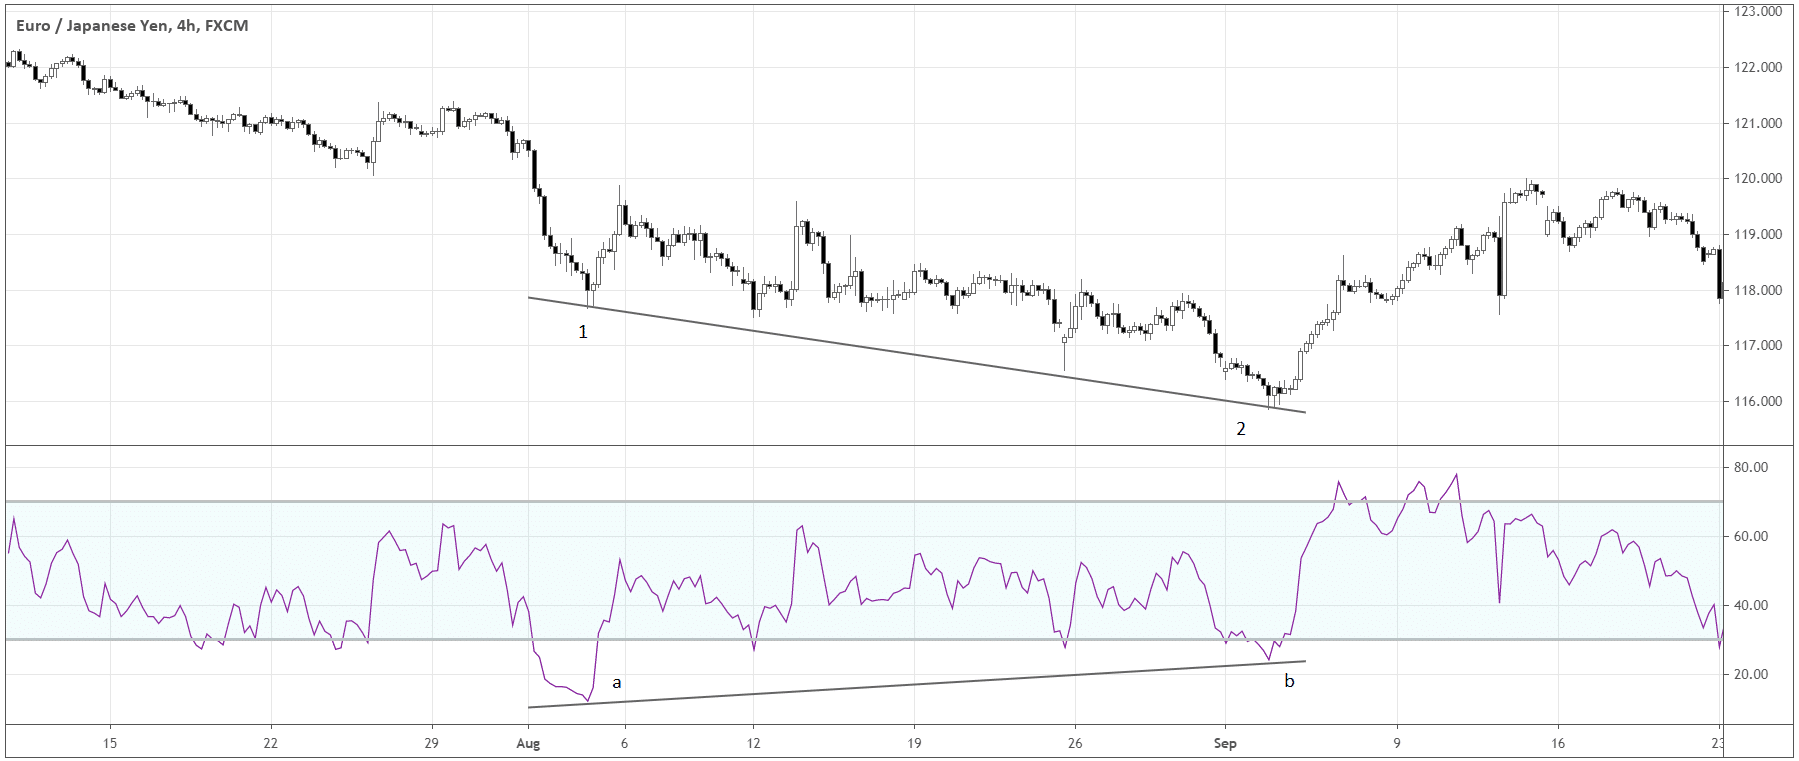
A possible signal of the bullish reversal occurs when price makes new lows, but RSI fails to make new lows. In the same way, a bearish signal is generated when the price makes new highs, but RSI fails to make new highs.
Here is an example:

We can see that while the market made a lower low (2), RSI made a higher low (b). This is a signal of the market losing momentum.
Think of RSI as a tool to simplify the perception of the market. Let’s say we need to measure the temperature outdoor. There are two ways to do that. If we spend enough time outdoor experiencing different weather conditions and also experience sufficient time indoor, we can develop a skill to “measure” the temperature intuitively. Eventually, we will be able to tell quite accurately, what is hot and what is cold, or even what is the most pleasant temperature. Another way is just to use the thermometer and feel a couple of times what temperature extremes might feel like! Both methods work, although, take a different amount of time to execute. The only difference with the “measuring” the market is the factor of probabilities – regardless of what “thermometer” you use, or whether you grew up in a forest or not, you never know exactly when your analysis is 100% correct.
The Final Thoughts
RSI is one of the core indicators that stood the test of time over extensive backtesting and the application to different asset classes. The indicator measures the price momentum – how fast the price moves relative to the movements in the past. The main signals that RSI generates are overbought or oversold conditions and the divergence of RSI with the price. Like many other indicators, RSI must be applied in the correct context of the market conditions. Traders must always complement RSI with additional tools to generate the most objective trading signals.
