RSI stands for Relative Strength Index, which is among the most popular technical indicators used by traders to build an insight into market psychology. It is a technical indicator based on the correlation between the average gain and the average loss. RSI was developed by a technical analyst, J. Welles Wilder, and was first introduced to the world of trading when Wilder published his book titled “New Concepts in Technical Trading Systems” in 1978.
RSI is a momentum oscillator that gauges the speed and direction of change of price movements and oscillates between an upper bound of 100 and a lower bound of zero. If the RSI value is 70 or greater, it indicates that the security is overbought or overvalued, i.e., the prices have increased more than the market expectations. Whereas reading of 30 or less suggests that the security is oversold or undervalued, i.e., the prices have declined too fast. These readings, in turn, signify that the trend is likely to move in the opposite direction in the nearest future.
Formula for RSI
Calculation of RSI takes two steps into account. To start with, the Relative Strength (RS) of average gain to average loss is incorporated in the following equation:

There is a default setting of 14 periods. In other words, RSI analyses past 14 candles or time periods. The value of average gain or average loss is computed by dividing the sum of gains or losses over that period by 14. Some investors might opt for shorter or longer time frames that have more extreme levels depending on the asset’s volatility trends. Once you have solved the first part, subsequent calculations are based on prior averages, and they ultimately smooth the result. And the index, therefore, lies between the range of 0 – 100.

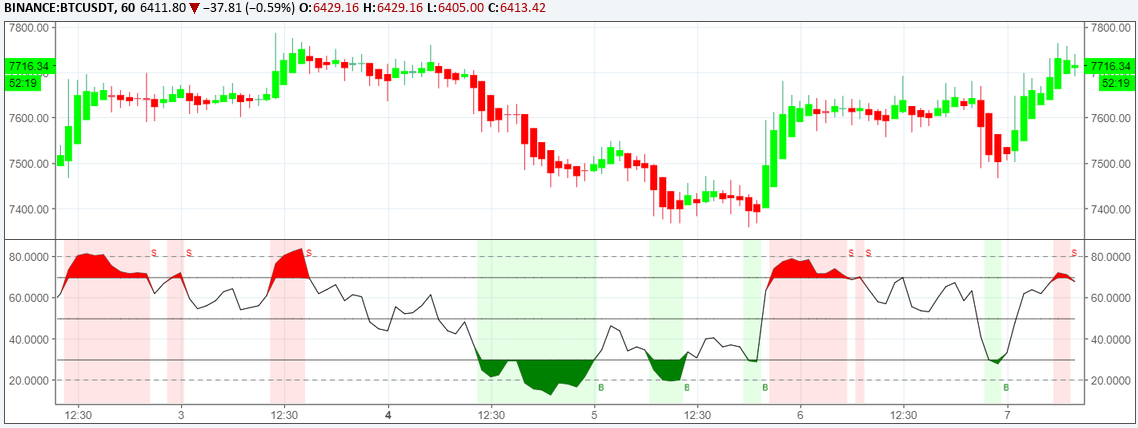
With the above formulae, RSI can be determined and plotted as a line graph under the asset’s price chart. It comprises an upper line, a lower line, and a dashed line corresponding to specific levels. To further illustrate this point, below is a chart highlighting overbought signals to buy and oversold signals to sell, in red and green colors, respectively.

How does it work?
RSI works similarly to the stochastic indicator, supported by the fact that it also provides overbought and oversold signals. If you want to assess price strength, identify the potential trading points in the market, and make more informed trading decisions, first, you need to be equipped with technical analysis. Below are the inferences that can be determined using RSI:
1. Divergences. In the context of an oscillator, divergence means a disagreement between price action and RSI. It can occur in two situations. One, the security price is either flat or increasing, but the RSI is decreasing (termed as bearish divergence). Two, the asset price is flat or decreasing, but the RSI is increasing (indicating bullish divergence). Both these points strongly suggest a turning point in the market, meaning that a corrective move will ensue in the opposite direction.
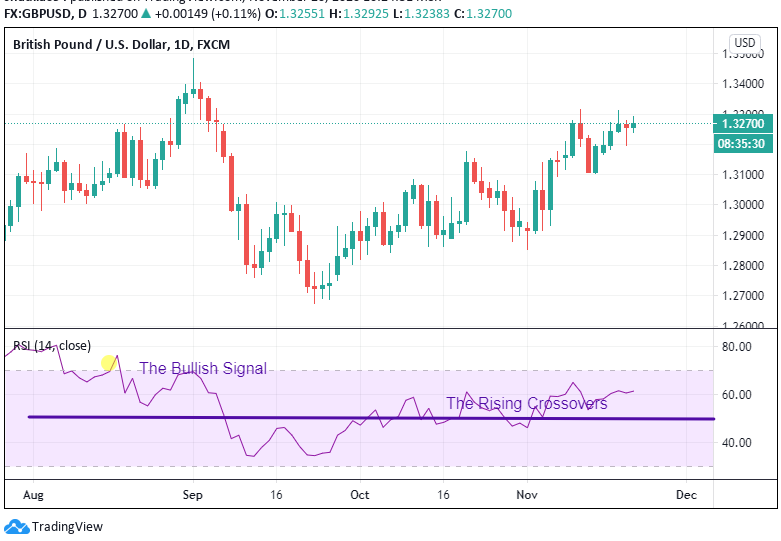
2. Centerline crossovers. Apart from divergences, traders also figure out midline crosses to make the most from RSI. When the RSI value increases above the 50 lines, approaching 70, the crossover is regarded as rising. It is a bullish signal until RSI reaches 70.

On the flip side, if the RSI value reaches below 50, moving towards 30, then it is perceived as a bearish signal until the RSI touches the line of 30. Such a situation is a falling midline crossover.
3. Parameters. The standard setting for the lookback period of RSI is 14, as noted earlier. But this period can be altered by analysts to meet their requirements. Shorter time frames have higher levels of sensitivity. Simply put, 10-day RSI has more chances of overbought or oversold signals than 20-day RSI.
4. Market Reversals. Market analysts also make use of reversals that occur when price outperforms momentum. These indicators are inversely related to the divergences. That is, positive reversals appear in bullish trends and suggest that the price will keep on increasing. Negative reversal, on the other hand, occurs in bearish markets and suggests that the price will continue to decrease.
Problems with using RSI
There doesn’t exist a flawless indicator, and the RSI possesses its own limitations. First and foremost, it is always advisable to rely on its signals when conforming to long-term trends.
It can also give rise to misleading signals, which makes it cumbersome to distinguish the true reversal signals. For instance, a false positive would be a bullish crossover succeeded by a rapid fall in the asset. While a false negative would be a situation of bearish crossover, still, the asset suddenly rises upward.
Since it is an oscillator, it can stay in the overbought or oversold signals for a long time. It clearly suggests that this indicator is best suited for markets where the asset’s price keeps changing.
In conclusion
RSI is an integral tool of technical analysis. You can simply predict its value by looking at the last 14 candles and get potential buy and sell signals. It is a good fit for a range-bound environment.
However, you shouldn’t put all your eggs in one basket and rely solely on RSI. Always use it in conjunction with other indicators to formulate a complete strategy. Moving Averages and stochastic indicators are the most preferred options when combining with RSI.
Lastly, remember that it is just a calculation based on what the market is doing, not a magic formula.
