A breakout in the financial market refers to a situation when the price starts a new trend after being in a range for a while. Trading breakouts can be highly profitable since most new trends start when the price moves above or below a range. A false breakout, on the other hand, refers to the situation when the price moves outside the range briefly and then comes back. In this article, we will look at the best strategies to trade breakouts and false breakouts.
What is a channel?
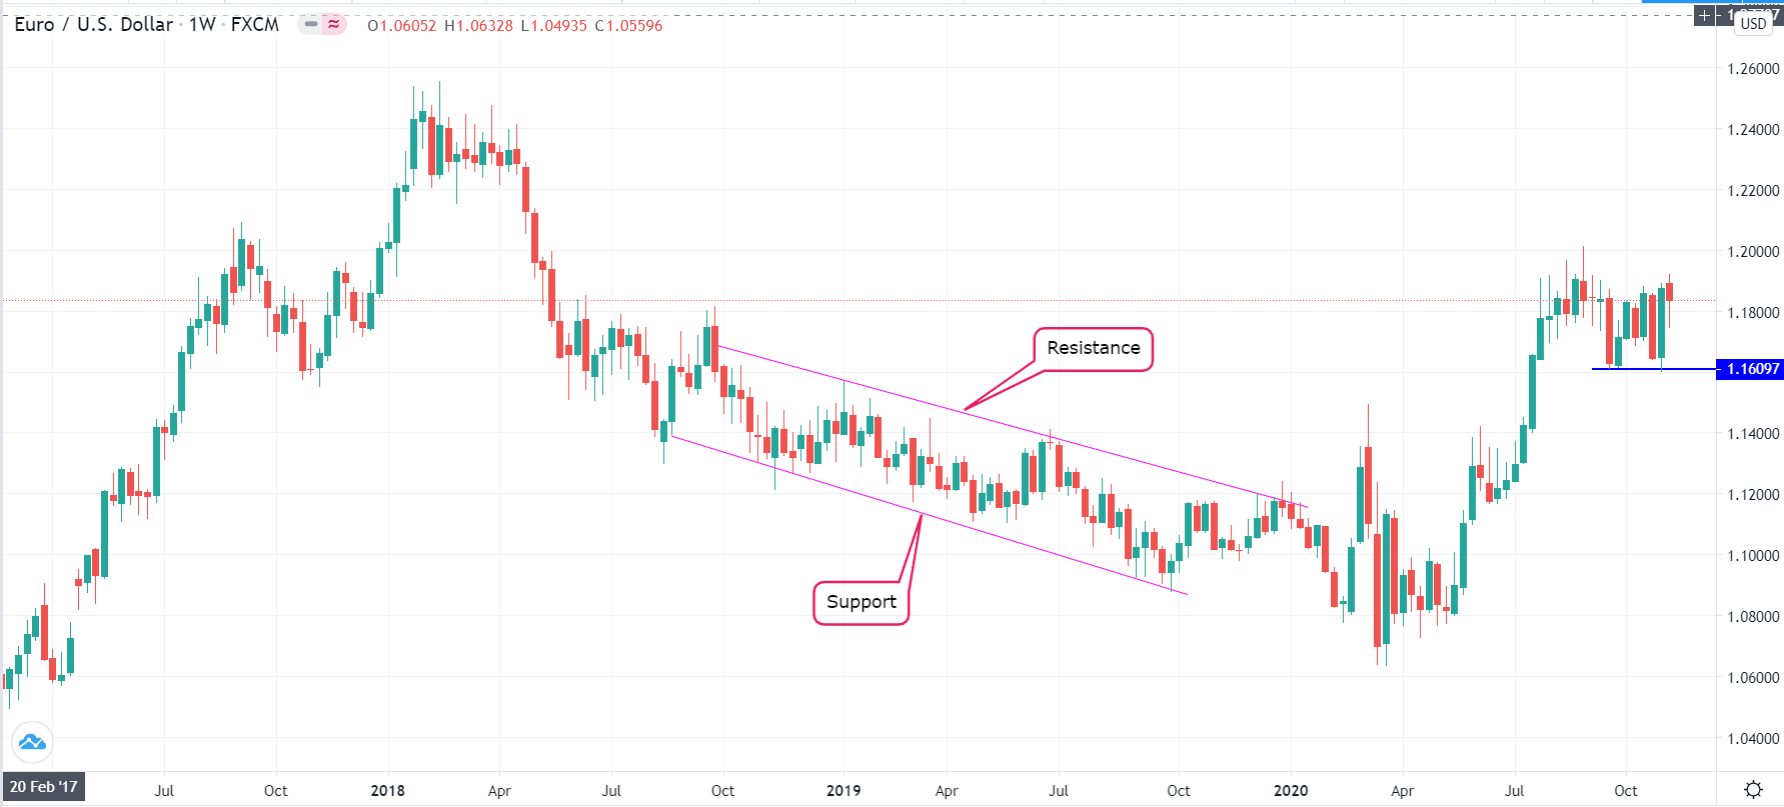
To trade breakouts, it is necessary to understand what a range is in the market. Ideally, a range or channel happens when a financial asset – currency pair, commodity, ETF, or stock – is making a series of support and resistance levels. Support is usually a floor where the price struggles to move below, while resistance is a ceiling where the price struggles to move above.
A channel can be angled or horizontal. It can also form in all timeframes, including hourly, daily, weekly, and monthly. The chart below shows an angled channel on the weekly EUR/USD pair.
Angled channel example
How to trade breakouts
Trading breakouts is not an easy kind of trading strategy. If it was, most day traders would be successful. In reality, most traders fail. The inhibition here results from how difficult it is to identify when a real breakout is happening. Also, it comes because of a concept known as a false breakout, which happens when the prices return back to the channel or suddenly reverses. Still, there are certain strategies for trading these breakouts.
Look for the build-up
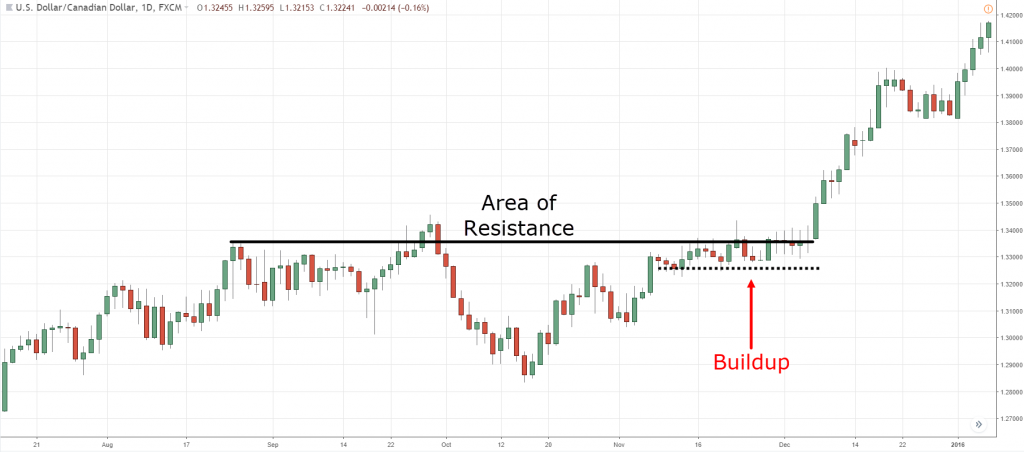
A common strategy of trading breakouts is to first spot a channel and then look for the build-up. A build-up is a period when there is a small consolidation inside a channel. Often, this consolidation happens slightly below the resistance level or slightly above the support. Ideally, when this happens, it is usually a signal that there is indecision among bulls and bears. But also, it tends to be a sign that the breakout will mostly happen in the direction of the consolidation. A good example of this is shown in the USD/CAD pair below.
Use pending orders
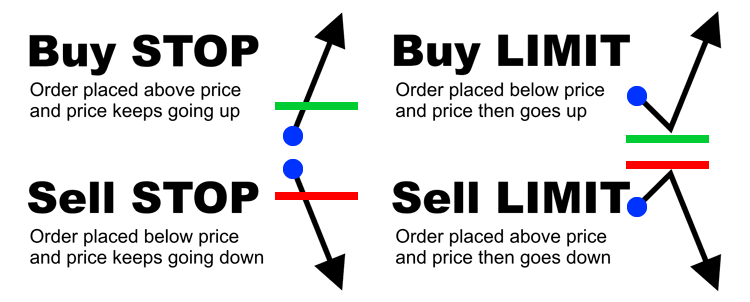
As mentioned above, the riskiest thing when trading breakouts are false breakouts. Therefore, the riskiest method to open these orders is using market orders. For starters, a market order is usually executed immediately when you press buy or sell.
You can mitigate market order risks by using pending orders. A pending order essentially directs a broker to initiate a trade at a certain level. In a buy stop, the broker will open a buy order if the price moves at or above a specified level above the current price. Similarly, in a sell stop order, the broker will execute a sell order at a price lower than the current price.
Pending orders cheat sheet
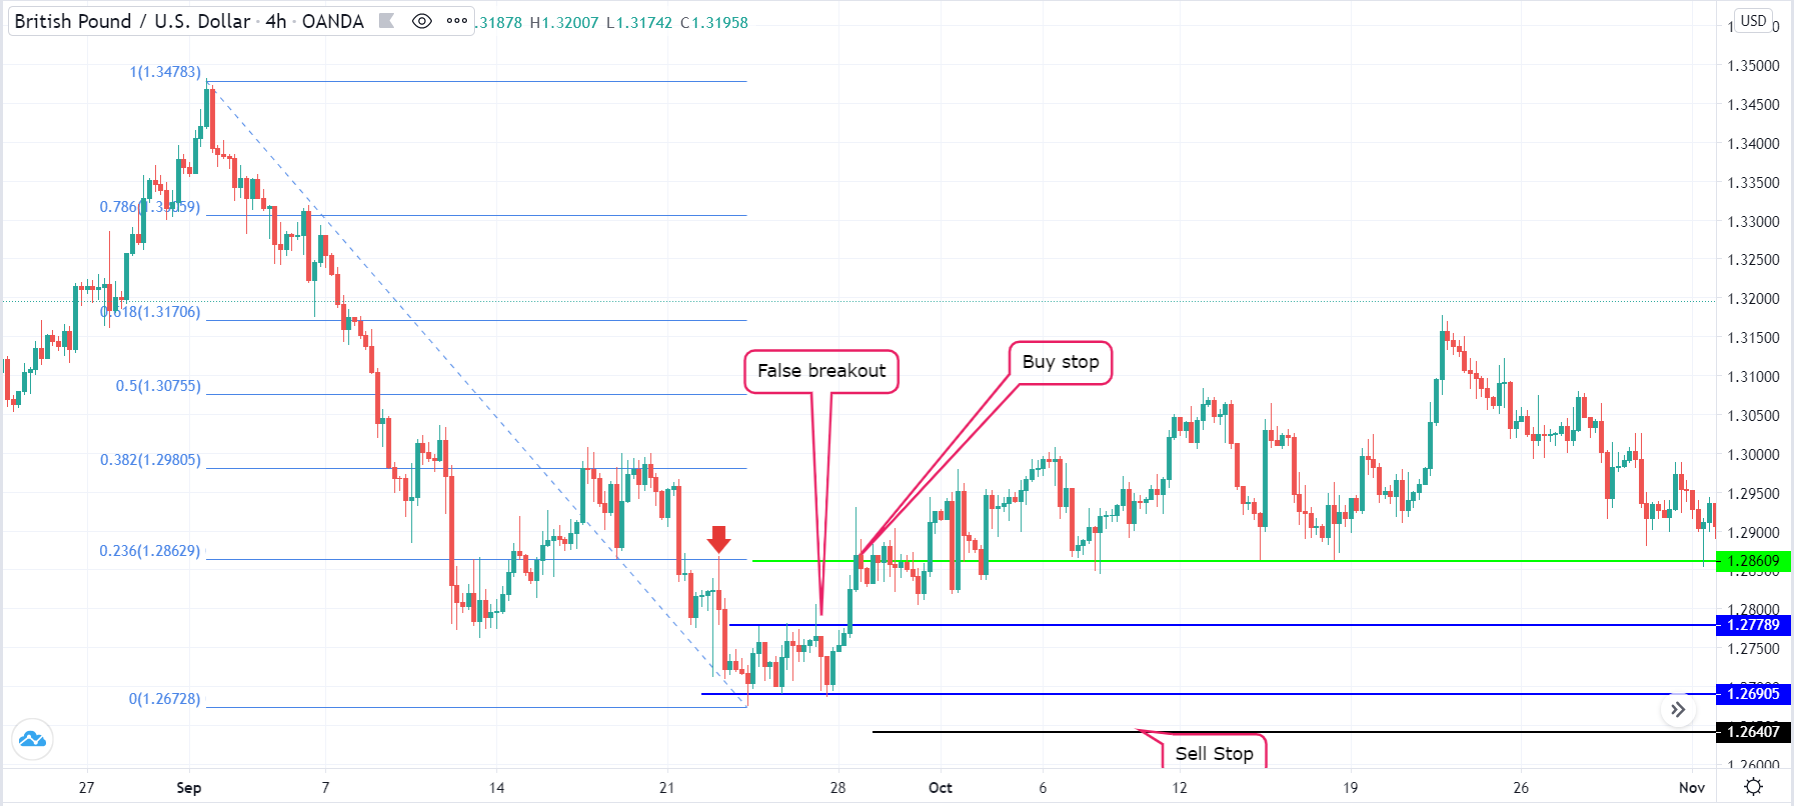
In the four-hour GBP/USD pair below, we see that it has formed a relatively small channel that is shown in blue. As this channel forms, no one knows which direction it will ultimately breakout in. Therefore, you can place two trades to take advantage of a potential breakout. You can place a buy stop at the 1.2860 level and a sell-stop at the 1.2640 level. In this case, if the price breaks out higher than it did, the buy trade will be implemented.
We chose the 1.12860 level because it is along with the 23.6% Fibonacci retracement level and also slightly above the September 22 high. On the other hand, we placed the sell stop at 1.2640 because of its psychological importance.
Using pending orders in breakouts trading
While pending orders are great at breakouts trading, bracket orders are better. A bracket order is better. A bracket order uses a combination of pending orders to limit your losses and maximize returns. For example, you can place a buy order and bracket it with a sell limit order above the price and a sell stop order at the lower side. Similarly, you can place a sell order and bracket it with a higher buy stop and a lower buy limit order.
Trading breakouts with wedges
Another approach to trading breakouts is by using candlestick patterns. Ideally, a wedge happens when the support and resistance lines of a channel are converging. There are two main types of wedges: rising and falling wedges.
A rising wedge usually forms when the consolidating channel is pointing upwards. This is usually a sign that higher lows are forming faster than higher highs. In a rising wedge, the market tends to break out lower. A falling wedge is usually a sign that lower highs are forming faster than lower lows. Therefore, the price usually breaks out through this channel higher.
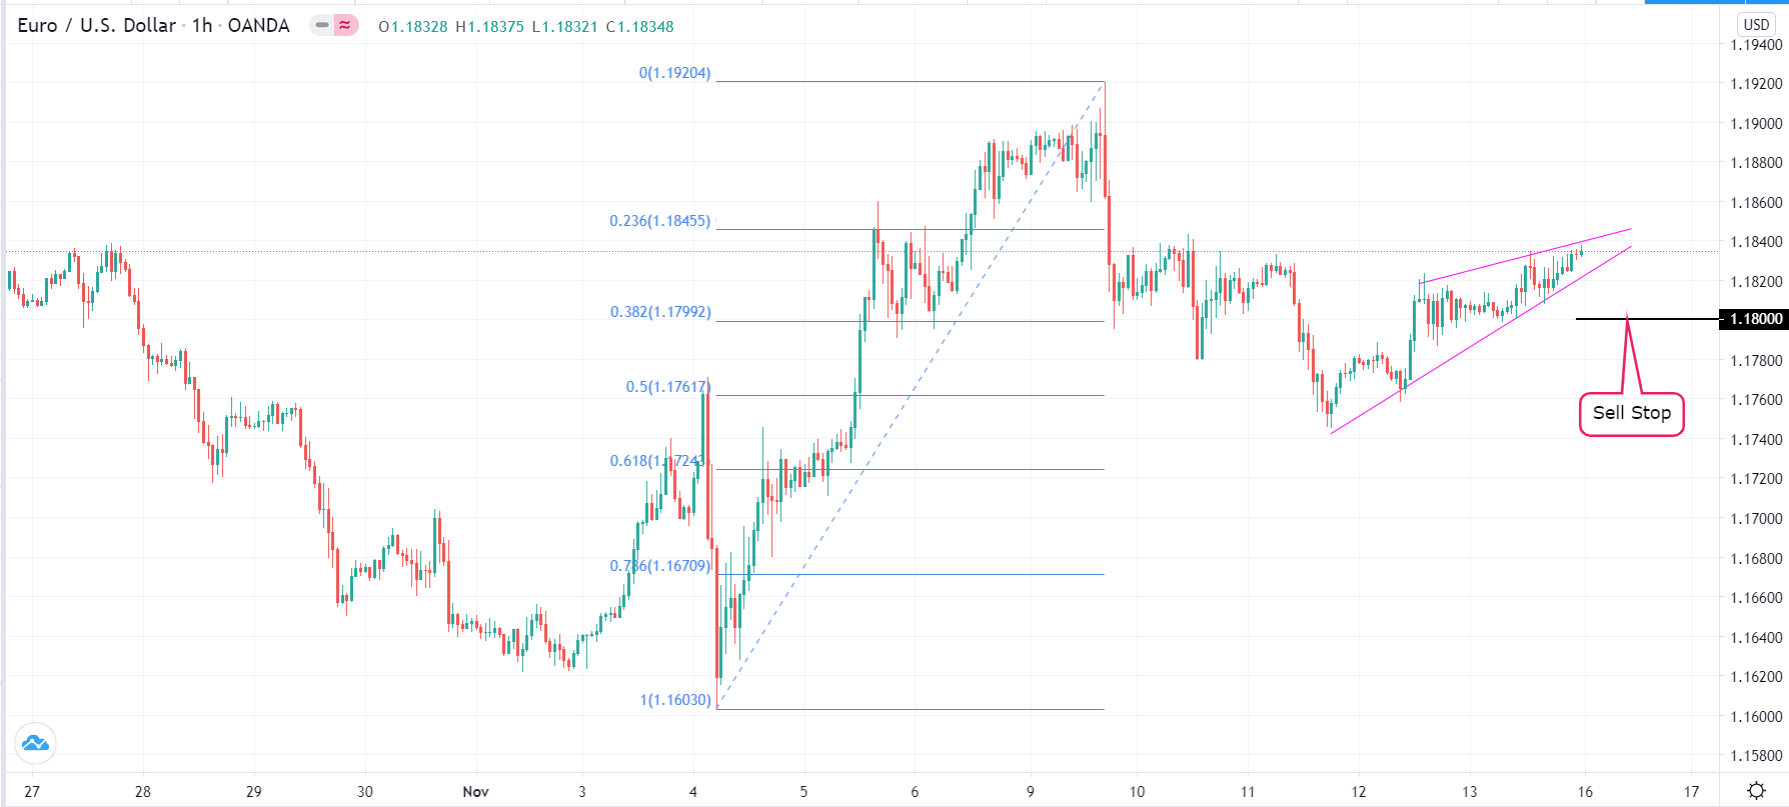
A good example of a rising wedge is shown in the hourly EUR/USD pair below. While it is not certain, the pair will ultimately break-out lower. As such, you can place a sell stop trade at the 38.2% Fibonacci retracement and important psychological level at 1.1800.
EUR/USD rising wedge pattern
Look at the bigger picture
Another approach to trading breakouts is to look at the bigger picture, especially when looking at angled channels. In most cases, the channels that happen in this situation are usually bullish consolidation in nature. As a result, they are known as bullish or bearish flags, and they happen when there is hesitation on whether the price can continue the momentum. A good example of this is shown in the four-hour AUD/CHF pair shown below.
Bearish flag example
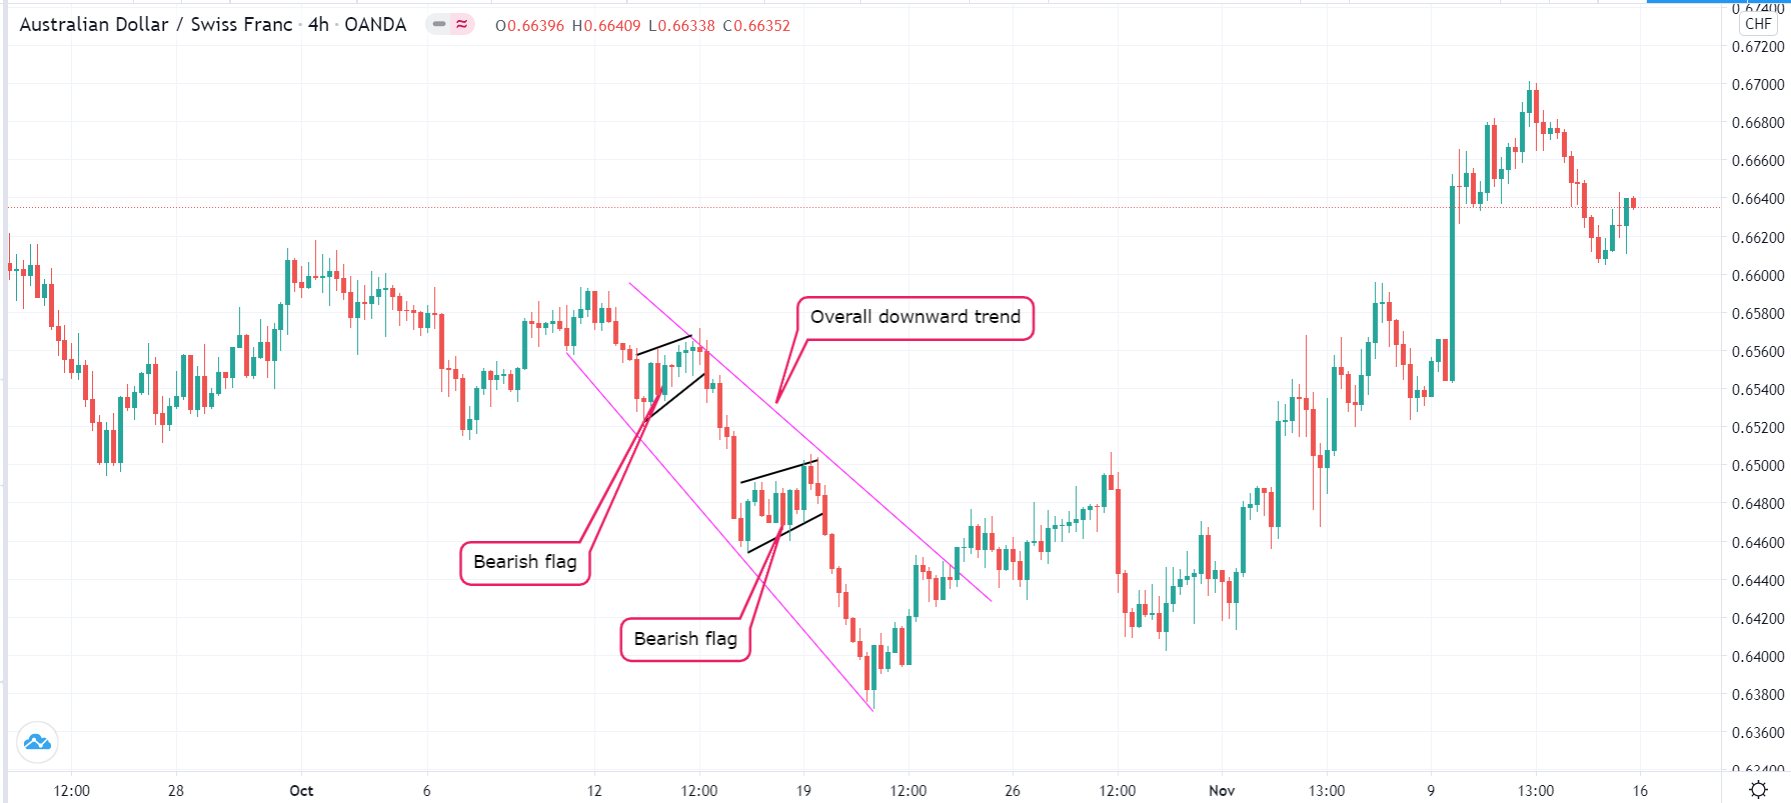
In this case, we can see the AUD/CHF pair is in an overall bearish trend. Between the channel, there are two bearish flag patterns. To trade such a bearish consolidation pattern, you should also open sell stop trades below the start of the flag.
Final thoughts
Trading breakouts may seem like an easy process. However, in reality, it is a relatively tough strategy, mostly because of the likelihood of false breakouts. As demonstrated above, the best approach to prevent these false breakouts is using pending orders. Another approach is to just be patient and see whether a breakout will hold.
