A range-bound market refers to a situation where the price of a financial asset is moving sideways. Its name comes from the fact that the price tends to oscillate between important support and resistance levels. A support level is viewed as a floor where the price struggles to move below, while resistance is a ceiling where it struggles to move above. In this article, we will look at how to identify and trade a range-bound market.
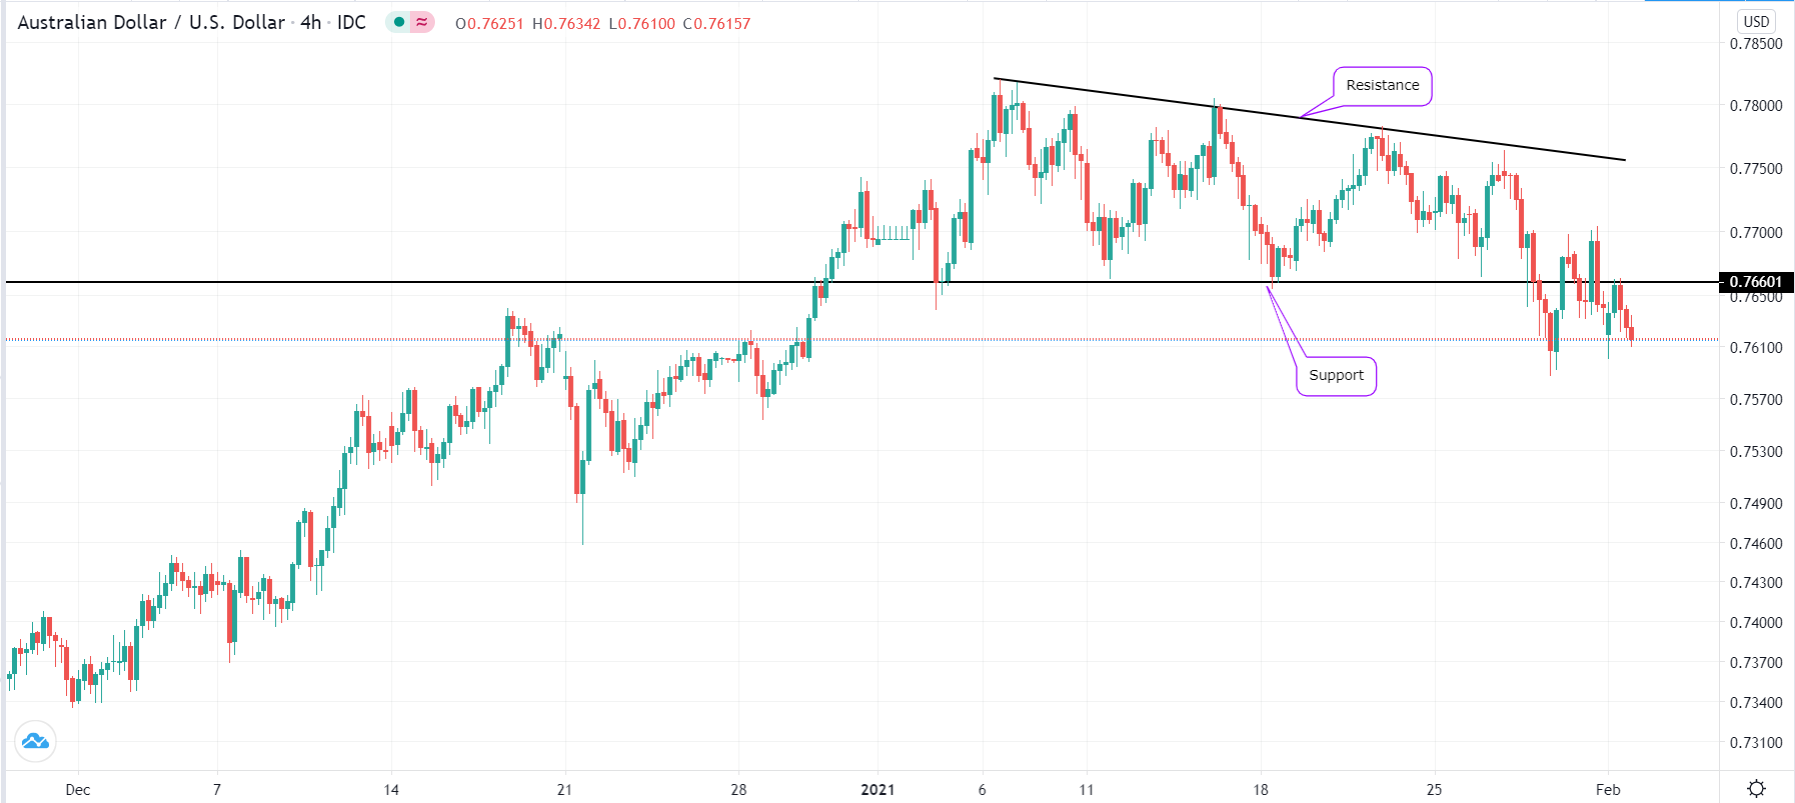
Range-bound market example

Range-bound market vs. a trending market
In general, there are three primary types of market movements. First, there is a range-bound market where the price is oscillating between levels of support and resistance. Second, there is a choppy market where prices move up and down without any direction.
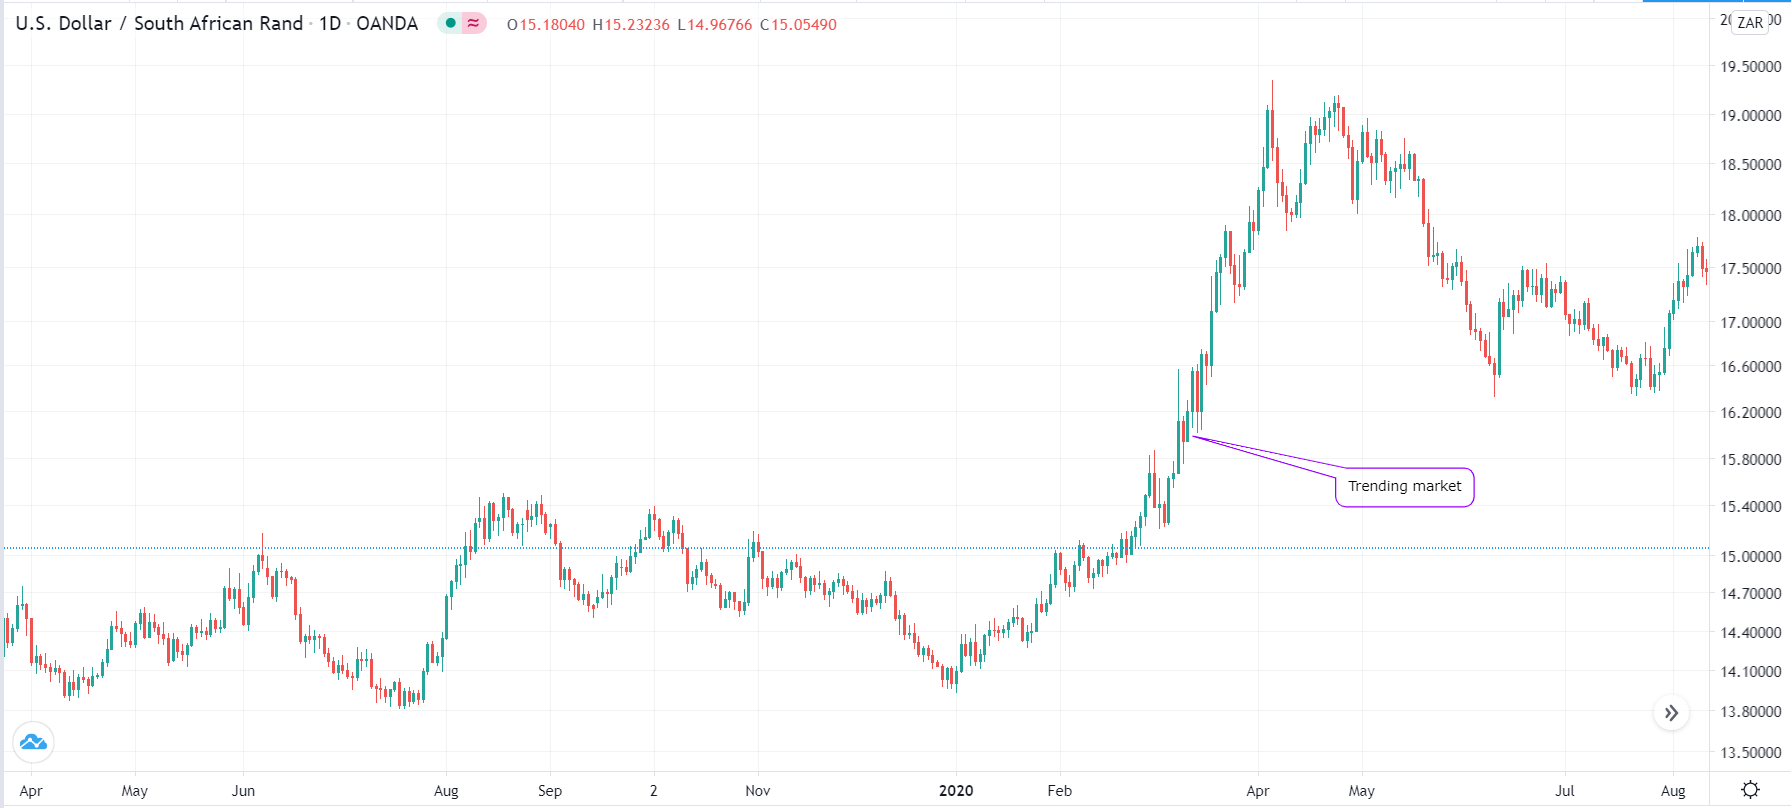
Finally, there is a trending market where the price is moving in a well-defined direction. This direction could be upward or downward. In such a situation, traders buy low, sell high, or sell high and buy low, respectively. A trending market is usually one of the most useful to traders and investors. The chart below shows an example of a trending market.
Trending market example

How to identify a ranging market
There is no scientific method of identifying a range-bound market. You just need to use your eyes. To do this, open the asset that you want to analyze and then see the underlying pattern. If it is the one shown above, that means that the price is trending. If it looks similar to the first one, it means that it is in a ranging market.
If you can’t identify a pattern, we recommend that you look at the time used for the chart. The price of an asset can be trending in the hourly chart but be ranging in the daily chart. Similarly, it can be ranging in an hourly chart but choppy in another period. Therefore, always adjust the charts to identify the nature of the pattern.
Next, you need to identify the support and resistance levels when you identify a ranging market. You can do this visually with no tool. Also, you can use the free tools provided by trading platforms like the TradingView and MetaTrader to draw these levels.
To draw the support, you just connect three or more low swings of the asset. This simply means that the price is struggling to move below these levels. Similarly, to draw the resistance, you just connect the upper swings, which imply that the price is struggling to move past this.
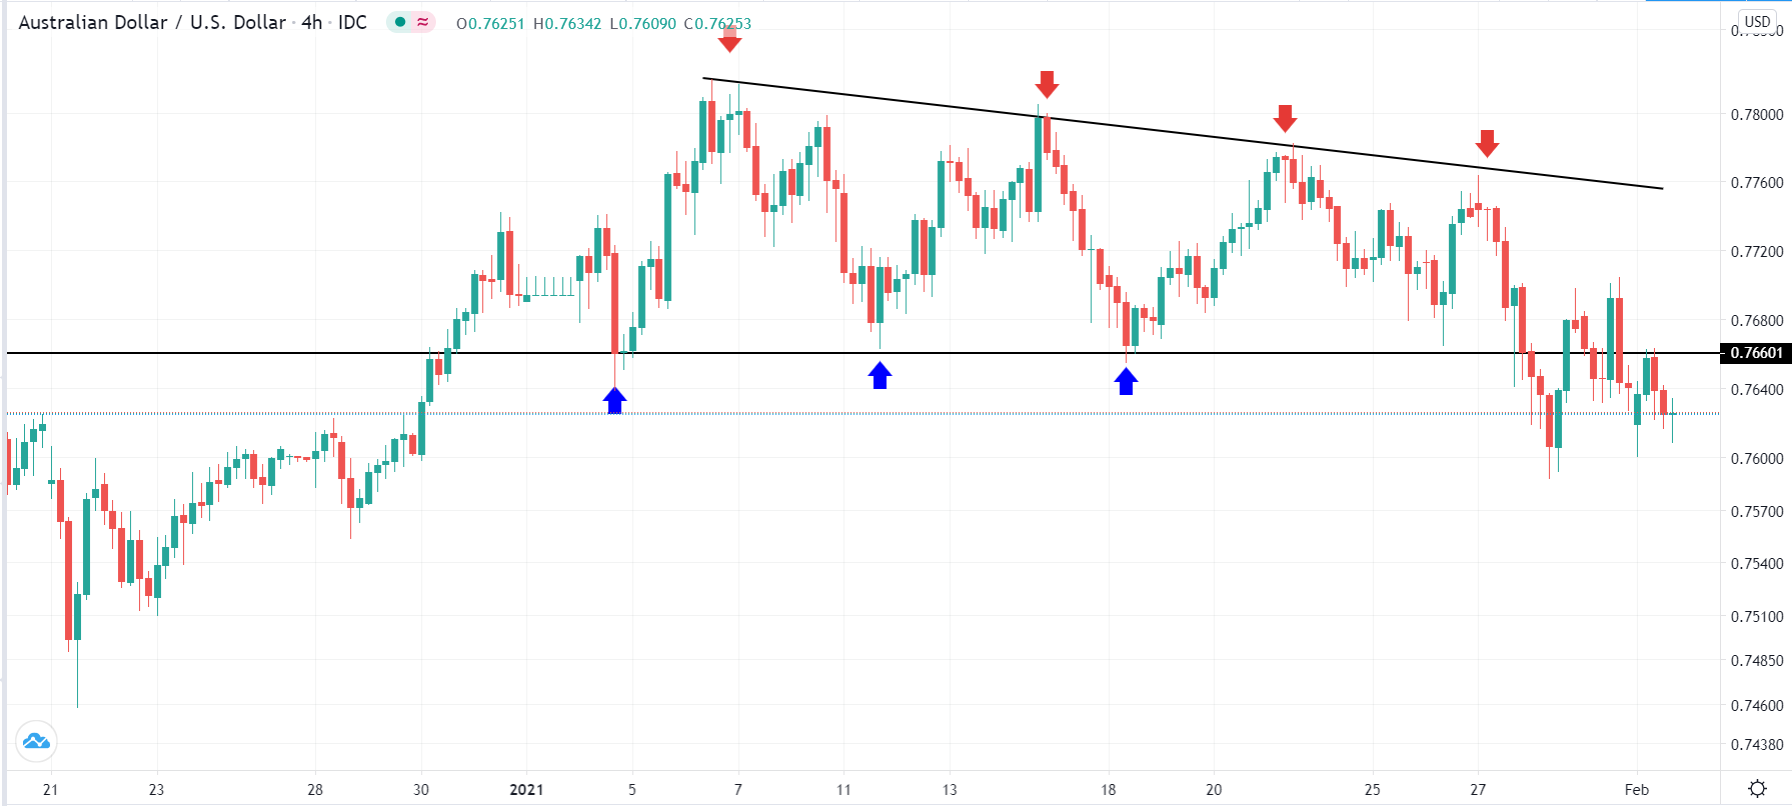
After identifying these levels, you can then buy when the price hits the support and short when it hits the resistance, as shown below.
Trading support and resistance levels

Using pending orders in range-bound markets
The first approach mentioned above is relatively popular. However, in reality, it tends not to work out well. That’s because ranges are usually not perfect, as shown above. Therefore, one of the best approaches is to use pending orders.
A pending order is where the trade is not opened right away. Instead, you direct the broker to open it when it reaches a certain level. For example, let’s assume that the AUD/USD is trading at 0.7660, which is between a range whose support is at 0.7600 and the resistance is at 0.8050. In this situation, you can open a sell-stop trade at 0.7585. If the price moves below the resistance and reaches 0.7585, the pending order will initiate a short position. Similarly, you can place a buy stop at 0.8060.
For starters, a buy stop will open a buy order above the current price, while a sell stop will open a short trade below the price. A buy limit, on the other hand, will initiate a buy trade below the price, while a sell limit will open a short trade above the price.
Trading range-bound markets breakouts
Another strategy of trading range-bound markets is to wait for a breakout. Ideally, these markets never last forever. Ultimately, a ranging market will always lead to a breakout. In fact, many day traders who watch ranging markets do that as they wait for a breakout.
There are several strategies for trading these breakouts, with the most popular being pending orders. In this situation, you just open trades above and below the support and resistance levels. In case the asset breaks out, the pending orders will be triggered.
Another approach is to look at the position of the range. If it happens in the midst of an upward rally, the range is said to be a bullish flag. It simply happens when some original buyers are exiting to take profit. In most cases, such a range will break-out higher. Similarly, if it happens during a bearish trend, it will often break-out lower.
Using indicators
Many day traders use indicators to trade ranging markets. A common indicator is the Bollinger Bands, which has three lines. The middle line is usually the most important. If the price manages to move above this line, it sends a signal that there are more buyers. As such, the price will likely rise to the resistance level. Similarly, if it moves below the middle line, it raises the probability of the price testing the support level. Other indicators you can use are the Donchian Channels, moving average convergence divergence (MACD), and envelopes.
Summary
A range-bound market is one of the most profitable day trading strategies in the market. As mentioned, ranges are relatively easy to identify, and there are several strategies for trading them successfully. However, ranges have their own risks, with the biggest one being a false breakout. This is when the price seems to be having a bullish or bearish breakout and then moving back to the range.
Also, you can buy at the support only for the price to have a bearish breakout. Therefore, having a stop loss and using pending orders can help you trade these markets successfully.
