
Today we will look at the Money Flow Index (MFI). This indicator has some similarities with the RSI. It weighs the volume traded, measuring the buying or selling strength of the money that enters and leaves the market.
So, what is the indicator and how does it work?
MFI compares the average price of the session with the average price of the previous session and multiplies by the volume traded in those sessions. If the result is higher, it implies that the capital flow is positive. If the result is less, it implies that the capital flow is negative.
As with the RSI, the most widely accepted configuration is to use a period of 14 days.
How we are supposed to read MFI
The graphic representation is also reminiscent of the RSI, i.e. linear. And is responsible for measuring the strength with which the price rises or falls, moving within the range from 0 to 100, which is delimited by two horizontal lines in zones 30 and 70.
These boundary lines reflect when the market is overbought and when it is oversold. Overbought would be when the value is in the range between 70 and 100, causing an alert in case the price turns down. Consequently, an asset would appear oversold when the value is in the range between 0 and 30, giving an alert in case the price turns up.
If the value is between the 30 and 70 zones, it could be said that there are no signs of overbuying or overselling, so the market is flat.
How I prefer to read it
The traditional estimates are that the zones which result in overbought or oversold conditions are 70 and 30, respectively. But in most cases, such values are too close to the norm. Personally, I consider that it is from the level of 80 and 20 when one can speak about either situation in full confidence.
When the MFI reaches 70 or begins to exceed it, it will be necessary to be vigilant because the overbought condition begins to appear. When the indicator reaches 80 or exceeds it, we’ll get a confirmation. Watch out if the price could turn down when the indicator is around 80.
And vice versa, when the MFI reaches 30 or drops slightly further, we will have to be vigilant because the oversold price becomes more evident. However, that is not necessarily the sign of an upcoming reversal. When the indicator finally reaches 20 or slides below it, be careful as the price will turn upwards at any moment.
The more extreme the value of the MFI, the more reliable a confirmation it will be that the price or market quote will turn and change direction.
Trend reversals to look out for
When it reaches overbought or oversold levels, it does not mean that the market price should turn around immediately, but the higher the MFI value, the more the real is the possibility.
Additionally, if the currency pair we are tracking is overbought or oversold, the market price turn is usually a short-term notion. We are not talking about the main trend change, but rather it is typically a minor pullback within a trend.
Naturally, sometimes the pullback and the trend reversal may appear similar, but that is until the course of the primary trend changes — not a usual thing.
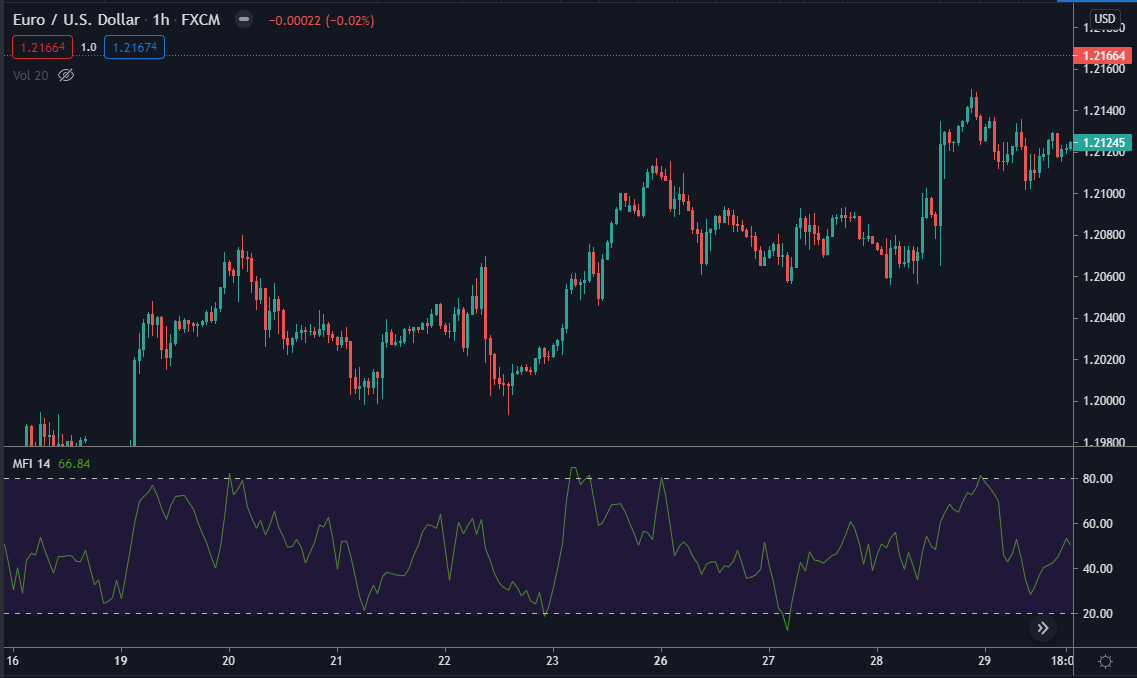
In the chart below, you can see an example of the graphic representation of the MFI indicator.
The buy signal will appear when the MFI is at oversold levels (20 or less). For its part, the sell signal will be the MFI at overbought levels (80 or more).
In this other graph, you can see how the MFI reaches overbought levels first, exceeding the 80 areas (box), and it is at that moment, the market price stops rising (circle) and begins to fall.
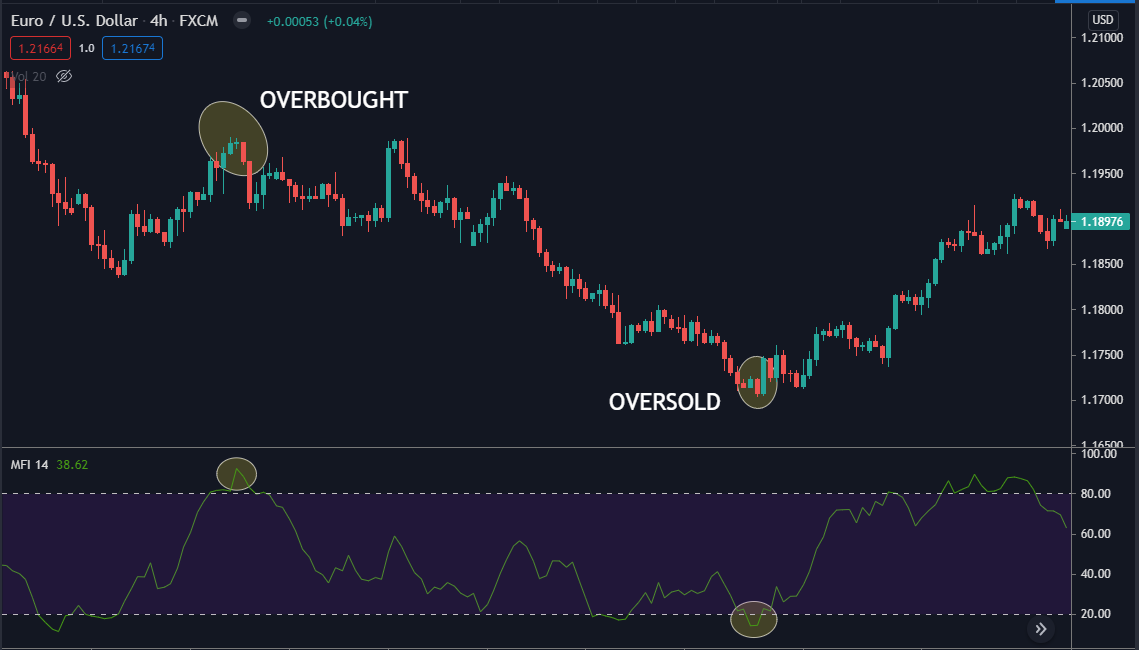
Subsequently, the MFI reaches oversold levels, touching the 20 zone, and the market price stops falling and begins to rise (circle).
In any case, it is the issue of divergences where this technical indicator’s usefulness lies in obtaining good buy or sell signals.
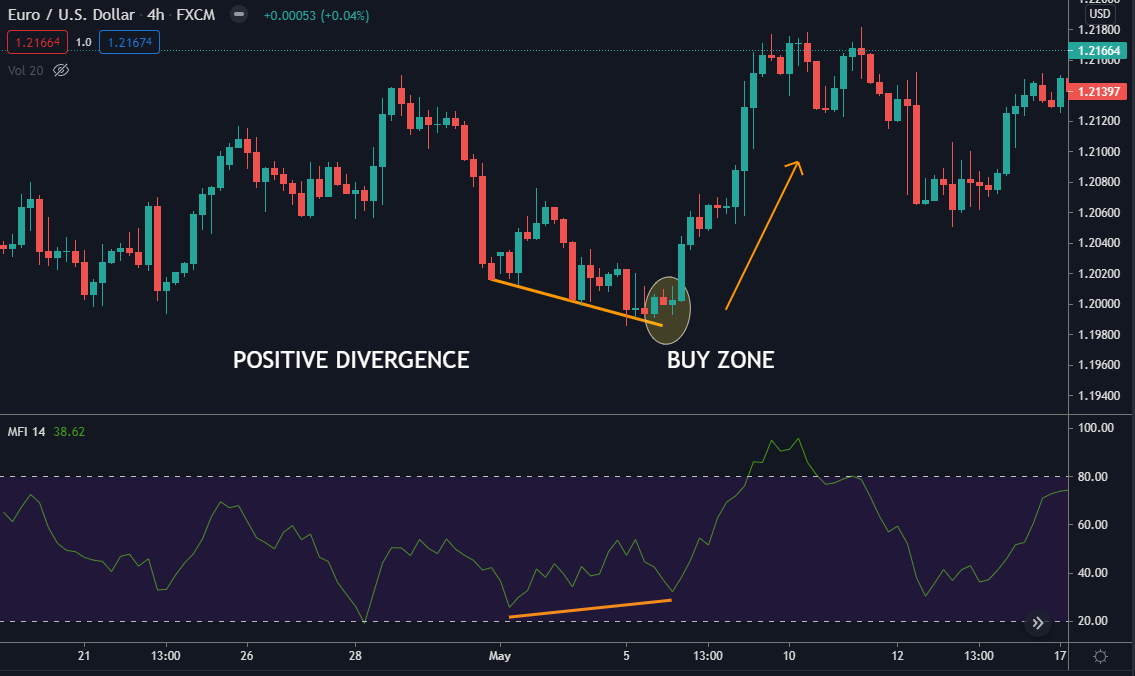
Positive divergence occurs when a sequence of consecutive price lows does not coincide with a sequence of consecutive lows in the technical indicator. This type of divergence could cause price increases.
The buy signal will occur when the market price forms two consecutive descending lows, and the MFI does not act the same but marks two ascending lows.
Divergence to consider
Here’s an example of positive divergence. The market price is falling (bearish trendline), and the MFI is rising (bullish trendline). The price eventually turns higher due to positive divergence.
A negative divergence occurs when a sequence of consecutive highs in price does not coincide with consecutive highs in the technical indicator. This type of divergence could cause price falls.
The sell signal will occur when the market price forms two consecutive ascending highs, and the RSI does not act the same but marks two descending lows.
Let’s look at an example of negative divergence. The market price is going up (bullish trendline), and the MFI is falling (bearish trendline).
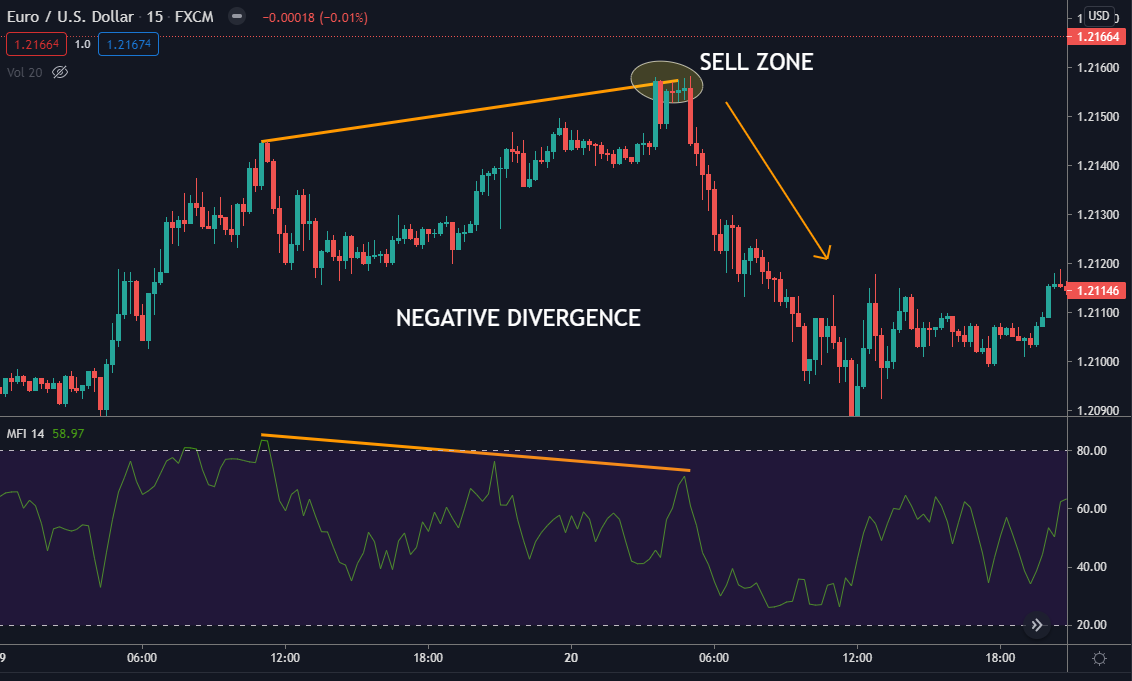
The price eventually turns lower due to negative divergence, confirmed when it tests the bullish trendline with pullback included.