In order to ascertain the movements of a currency pair, a trader has to have some sort of a method to study historical as well as current price movements. In this article, we go through all the things about Forex charts that a beginner trader needs to know about to make use of his/her trading decisions.
What is a Forex chart?
Forex charts enable you to view the rate of exchange between two currencies and the changes that take place in the rate over time. These charts come in handy for everyone, particularly for novice traders, since they help you know the markets better and be successful in Forex trading. You can find Forex charts for different currency pairs, such as GBP/JYP, EUR/USD, etc.
Forex Charts and Time Frames
A Forex chart represents the movement of a currency pair price visually over a particular time period. It is also the first tool in the trader’s box that a trader learns to use. Basically, a Forex chart highlights what the trading activity looks like for the period of a single trade. The period can be 10 minutes, 4 hours, a day, or a week-long.
Prices keep on fluctuating and changing and appear to be no more than random events. But, a trader assesses the probability of future changes in a particular direction and manages risk.
The vertical axis (or the x-axis) represents the price, while the horizontal axis (or the y-axis) is the time. On a Forex chart, the price is plotted from left to right. The latest price point is to the extreme right.
One can find out the changes in demand and supply through a price chart, as it is because of this that we get the fluctuating line of the currency pairs. All the transactions concerning the currencies are aggregated and displayed on the chart. It blends all the activities from all the participants in the market, be they human or algorithmic.
3 Types of Forex Charts
Let’s take a look at the three major types of Forex charts that all traders invariably come across:
Line Chart
This is the simplest of all Forex charts as it is nothing more than a simple line that is drawn from the starting point to the closing point. When one strings a line together through these points, one can easily see how the price is moving over a particular time period.
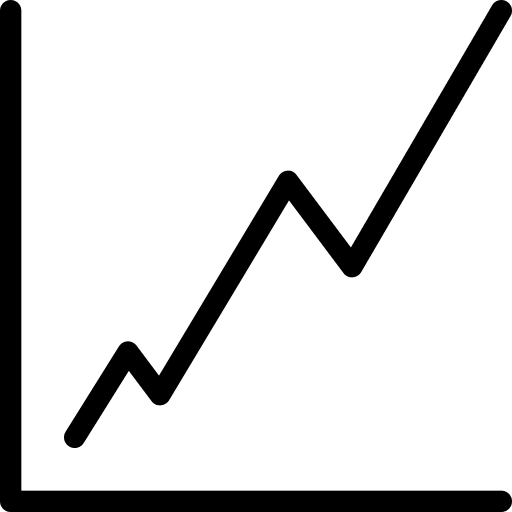
This chart, though it is easy to understand, may not provide a trader with a whole lot of detail about the behavior of the price within the period. All one gets to know is that the trade is closing at a particular point, nothing more. However, it does help the trader to visualize and compare the closings points from one period to the next. Traders generally use this chart type to get a holistic view of the price movements.
Bar Chart
This chart, if it could be called that, could be considered more of a bar. It is also a bit more complicated than a simple line chart. Not only does it highlights the opening and closing points, but also the highs and lows that allow a trader to see the range of price movements within a given period.
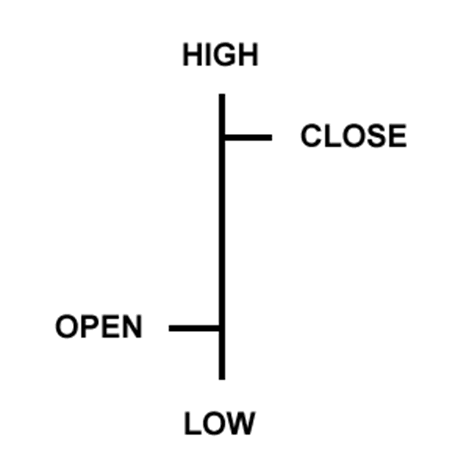
The range or size of the bar may change from one to the next over a range of multiple bars. As one would suspect, the highest price paid is indicated by the bar-top, while the lowest traded price is demonstrated by the bar-low.
When the fluctuations rise, the bars tend to get bigger, and when the fluctuations are quietened, they are smaller.
Do note that one bar represents a single time segment. It could be an hour, a day, or a week. Bar charts are also termed as OHLC (for Open, High, Low, and Close).
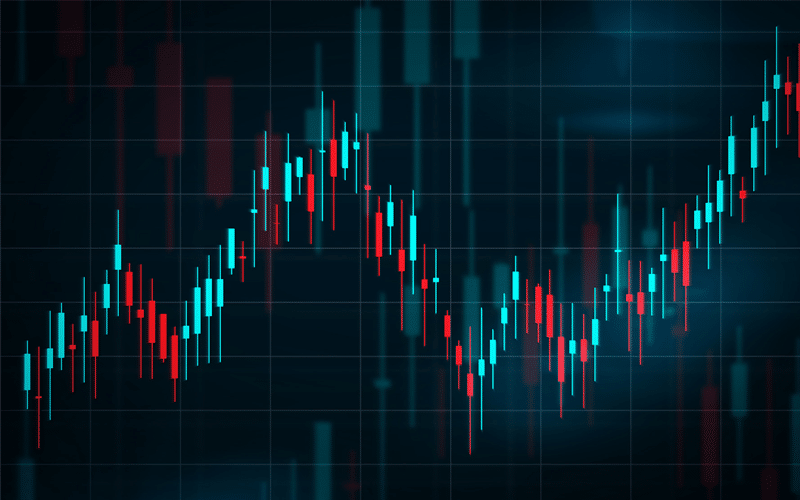
Candlestick Chart
This chart type is a variation of the previous chart but it is represented in a graphical format that many traders find conducive. The larger bodies or blocks highlight the opening-closing trade range.
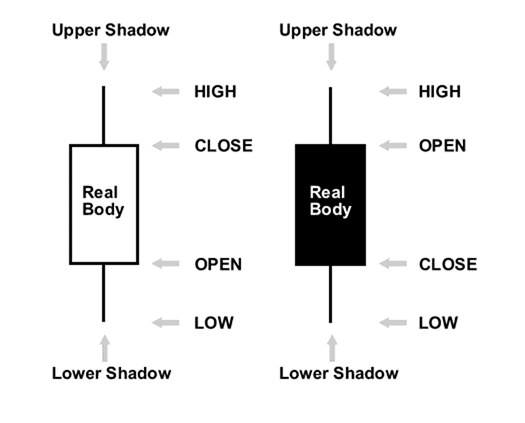
The bearish and bullish market sentiment is represented by these bodies and is colored differently. If the middle block is colored black, then the currency has closed at a lower point than it opened. Alternatively, the middle block will be colored white if the price closes at a higher point than it opened.
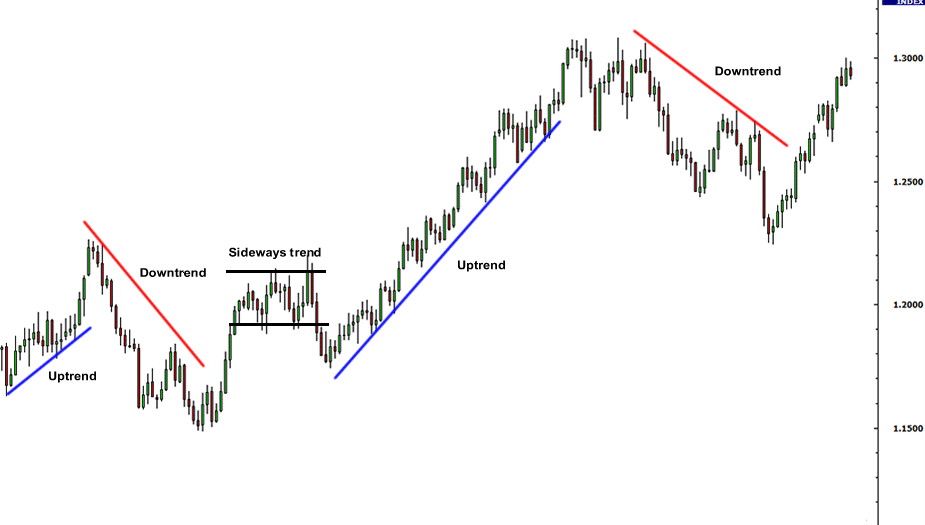
The candlestick charts are ideal for recognizing the turning points of the market. One can easily identify the reversals, from uptrends to downtrends, and vice-versa.
Using technical indicators on Forex charts
Technical indicators are mathematical computations that are based upon the different variables, such as volume and price. Traders use technical analysis to assess the entry/exit points for a trade. Though there are various such indicators, they fall mostly under two primary categories.
- Overlays
Those indicators that utilize the same scale as prices and are plotted on top of the price movements on a chart are termed as overlay indicators. Examples of this could be found in Bollinger Bands and Moving Averages.
- Oscillators
Those indicators that vacillate between a minimum and maximum and are plotted either above or below the price chart are called oscillator indicators. Examples of this include MACD and Stochastic Oscillator.
Traders utilize such indicators when they are trying to assess the security and find out how best to trade and when and where to have entry/exit and other orders. Traders often look to combine the different technical indicators with other, more subjective forms of analyses, such as chart patterns, in order to come up with ideas for trade. These technical indicators can also be brought in to automated trading systems because of their quantitative and objective nature.
Conclusion
Charts and technical indicators are not only easy to read but they also provide the trader with a pattern by which s/he can figure out how to trade. They can be configured to display trades over any time frame, be it over minutes, hours, days, or weeks.
Their simplicity is what has made them so popular amongst traders as well as their utility. Every beginner trader has to learn how to read these basic charts before s/he can consider trading as these are fundamental to the trade and one is bound to come across them often.